
Mapping Regional Vulnerability to Energy Poverty in Poland


1
Department of Microeconomics, Cracow University of Economics, 31-510 Cracow, Poland
2
Department of Statistics, Cracow University of Economics, 31-510 Cracow, Poland
3
CENSE—Center for Environmental and Sustainability Research, NOVA School of Science and Technology, NOVA University Lisbon, 2829-516 Caparica, Portugal
*
Author to whom correspondence should be addressed.
Sustainability 2021, 13(19), 10694; https://doi.org/10.3390/su131910694
Submission received: 27 August 2021
/
Revised: 18 September 2021
/
Accepted: 22 September 2021
/
Published: 26 September 2021
(This article belongs to the Special Issue Multidimensional Perspectives for Energy Poverty Sustainable Mitigation)
Abstract
:Raising concerns about the effectiveness of the energy poverty policy actions in Poland, such as Clean Air and Stop Smog, brings forward the need to apply different strategies to identify the energy poor. More than 13.7% of Polish households were energy poor in 2018 according to the ability-to-keep-home-warm indicator. This study proposes enhancing the model-based approach to measure households’ energy poverty. Our goal is to assess regional vulnerability to energy poverty in Poland. The study relies on three national datasets and is conducted in two steps. The Energy Consumption Survey (2018) and the Household Budget Survey (2018) provide data for modeling household’s energy poverty in the first step. The Local Data Bank (2019) gives information on the potential factors increasing regional vulnerability to energy poverty evaluated in the second step. We apply multiple linear regression to identify energy-poor households and principal components analysis to examine the regions’ vulnerability factors. As a result, we produce several maps showing the spatial distribution of vulnerability to energy poverty in 380 Polish districts. Our results indicate that some northern, southern and eastern districts in Poland are primary targets of energy poverty policy actions.
1. Introduction
The Energy Policy strategy of Poland that will remain in place until 2040 [1] discusses the approach to improve the economy’s energy efficiency and to respond to energy poverty and low-stack emissions problems. The recently adopted Stop Smog program [2] further states that the energy poor are the main target of low-carbon projects, co-financed by the state and implemented locally. This program supports the already-implemented policy actions regarding house renovations [3]. At the same time, there is no definition of energy poverty in the country, which makes program realization more challenging since there is no specific national policy umbrella for the measures design. Instead, the law authors stipulate that targeted populations are low-income and live in single-family buildings in areas detailed in the anti-smog bill [4]. Therefore, policies can target specific groups of people due to their socioeconomic profile (e.g., low-income, elderly), though energy poverty also has significant spatial manifestations. For example, the smog that causes premature deaths is a local problem; thus, when prioritizing energy poverty and mitigation measures, it is important to consider spatial targeting.
This study provides policy-makers with more information on the spatial distribution of energy poverty in Poland, looking deeper into regional patterns. Current studies on energy poverty in Poland use either the EU-SILC microdata or the Household Budget Surveys (HBS). In both cases, the spatial identification of energy poverty is limited to macro-regions (i.e., the highest level of administrative division), which are large on the one hand and very heterogeneous on the other. To effectively identify and combat energy poverty, it is necessary to consider areas at a lower level of aggregation. Our study is the first to identify the energy poverty risks at the district level in Poland. To meet this challenge, in this work, we will use the Local Data Bank (in Polish, Bank Danych Lokalnych, BDL, https://bdl.stat.gov.pl/BDL/start, accessed on 1 February 2018) database, which represents 380 districts in Poland and combines the energy poverty-relevant information from this database with the energy poverty distribution obtained for regions. In this way, we will approximate the risk of energy poverty in the districts, offering decision-makers an effective tool to identify energy poverty at a low level of spatial aggregation.
Two approaches to identifying the energy poor are combined in this study. One approach is model-based, in which we estimate household energy poverty by computing required energy costs and household after-energy-costs disposable income [5,6]. The other approach is geographical identification [7,8,9], in which we spot regional vulnerability to energy poverty considering four dimensions of vulnerabilities revealed in principal components analysis (PCA). We analyze the overlap of both phenomena by highlighting the most problematic districts, i.e., on the second-level 380 administrative units in Poland.
The goal of the study is twofold. First, we enhance our methodology of identifying the energy poor by adding the geographical distribution of regional vulnerabilities to household energy poverty. The first research question we answer is, what districts are the most vulnerable to energy poverty? Second, we examine in detail the components of regional vulnerability in 380 Polish districts based on seven factors, i.e., respiratory diseases, single-family houses, average salaries, the population in the post-productive age, social benefit recipients, population density, and rent arrears. The second research question we answer, is what are the dimensions of regional vulnerability in Poland?
This study contributes to the literature on the spatial distribution of energy poverty and enhances the traditional approach [10,11] of the direct identification method of energy poverty through database crossing [12,13]. The indicator-based approach has gained popularity in Poland’s energy poverty studies [14] and worldwide [15,16], but has its limitations. Specifically, energy poverty indices provide little information on the vulnerability of small administrative units, which are valuable not only for policy-makers, but also for the local community. This study attempts to cover this gap.
Geographical distribution of energy issues—particularly energy poverty and energy inequalities [17]—attracts researchers looking for new evidence on the topic [18]. This strand of literature represents studies from multiple disciplines, such as economy, engineering science, geography, etc., united by a common problem of energy poverty. The first to mention is the study by [19] focusing on the buildings’ energy needs and the consumption aspects of regional vulnerability. That study aimed to develop and showcase a high spatial scale index to characterize and address the problem at a regional level, highlighting vulnerability hotspots for local action in the winter and summer. The authors propose the energy poverty vulnerability index, comprising of buildings’ energy performance gaps [20] and the ability to implement alleviation measures sub-indices, bringing together several socioeconomic determinants. In the current study, we rely on some similar socioeconomic indicators.
The small-scale area prediction of energy poverty is made by [21], showing the importance of geographical identification for local policy actors. The authors show the spatial distribution of energy poverty to inform the local actors on the effectiveness of the respective policies. Similarly, the goal of the study by Robinson et al. [8] is to depict the socio-spatial variation of regional vulnerabilities to energy poverty measured by a set of indicators related to energy efficiency, the precariousness of building stock, households’ financial capacity, and energy consumption practices and needs. The authors suggest that national and local authorities consider regional heterogeneity of vulnerability to energy poverty as a valuable tool for targeting energy poverty. Robinson and Mattioli [22] further studied the geography of energy vulnerability, which complements household energy poverty with transport energy poverty to obtain the map of double energy vulnerability. The broader understanding of vulnerabilities allows us to consider more aspects of households’ difficulties in satisfying their energy needs.
It is worth mentioning the study by Frankowski [23] on smog alerts in some Polish agglomerations. The alerts are designed to inform and resolve the air pollution issues. Yet, people for whom solid fuels are the only source of cheap energy frequently demonstrate hostile attitudes towards smog alerts, suffering from stigmatization. Undoubtedly, energy poverty goes hand-in-hand with low-stack emissions in Poland, and clean air state programs aimed at improving air quality do not consider the potentially regressive distributional effects, as claimed by Frankowski and Tirado Herrero [24].
Most of the studies on energy poverty in Poland focus on the geographical distribution of energy poverty at the NUTS2 level, for which data is available in the HBS [14,25]. In the study by Lis et al. [25], the authors provide evidence on the substantial regional disparities in terms of energy affordability (measured by the Low Income High-Cost indicator) and thermal comfort (measured by the subjective energy poverty indicator, i.e., the ability-to-keep-home-warm indicator). Differences in climate and energy prices are additional factors that explain energy poverty contrasts in the regions. Sokołowski et al. [14] further state that the spatial distribution indicated by the multidimensional energy poverty index is counterintuitive, as the level of urbanization does not coincide with the energy poverty map. In both studies, the regions-level geography is discussed.
The fact that regional vulnerability to energy poverty in Poland could vary a lot, as mentioned in previous studies [14,25], calls for a study in which attention is paid to the district-level variations of the issue. In this study, we try to remedy this lacuna.
The novelty of our strategy lies in the combination of both approaches: the energy poverty index and small-area geographical identification in Poland. This way, we develop an alternative mechanism to assess energy poverty in Poland with high geographical detail. Once the most troublesome regions are spotted, the local community might be able to identify the energy poor. We are inspired by the energy poverty vulnerability index put forward by Gouveia et al. [19] for all Portuguese 3092 civil parishes, and their local applications, as in Gouveia et al. [26]. This index accounts for many factors that help spot the regions with the highest probability of energy poverty occurrence.
Our study is conducted in two steps. The first step consists of the assessment of household energy poverty. We adopt the approach developed in earlier research on hidden energy poverty in Poland by Karpinska and Śmiech [5]. It is solid fuels, specifically coal, that Poland has in abundance, which is the preferred energy source of many households. Together with the tendency to restrict energy consumption because of budget constraints, as also highlighted for other EU regions by Antepara et al. [27], cheap solid fuels play a decisive role in lowering the actual energy costs while preserving the low level of general wellbeing. Our model estimates the necessary energy costs given the households’ needs and the buildings’ characteristics. Having the required energy costs allows us to assess whether a household is pushed below the energy poverty line (the energy poverty threshold is set at 60% of the national median of after-energy-costs disposable income) or not, in case of achieving energy comfort.
The second step involves the analysis of districts’ ability to overcome energy poverty issues. We spot areas on the map of Poland in which struggling with energy poverty is extremely difficult for households. Our research strategy involves examining seven determining factors of increased regional vulnerability and combining them with the assessment of household energy poverty. The socioeconomic factors we choose describe districts in Poland in terms of population wellbeing, building condition, and air quality, using the proxy indicator “respiratory diseases per 1000 inhabitants”. We rely on a set of data, which includes the Energy Consumption Survey—2018 (in Polish, Ankieta o zużyciu paliw i energii w gospodarstwach domowych, EGD); the Household Budget Survey—2018 (HBS), which are available upon request for scientific purposes; and the Local Data Bank (BDL)—2019, which is publicly available online.
The study is divided into six sections and continues as follows: the following section details our methodology; the third section presents the preliminary statistics of the three datasets used; the fourth section discusses results; and the fifth section concludes.
2. Methodology
This study aims to explore the regional vulnerability of Polish districts to households’ energy poverty to guide policy-makers in policy targeting. Our primary concern is areas on the map of Poland where a high incidence of households’ energy poverty is accompanied by regional weaknesses on key energy poverty determinants.
We develop our analysis in two steps. In the first step, we identify households affected by energy poverty. Here, we adopt the approach to estimate hidden energy poverty in Poland as in Karpinska and Śmiech [5]. The after-energy-expenditures disposable income is equivalized based on the OECD-modified scale, where 1 is assigned to the first adult, 0.5 is assigned to the next adult, and 0.3 is assigned to children below 14 years old.
In the second step, we examine factors determining districts’ vulnerability to energy poverty. We draw inspiration from the research by Gouveia et al. [19], who consider socioeconomic indicator analysis to be an essential part of the energy poverty vulnerability index. The intersection of both energy poverty and multiple factors of regional vulnerability to energy poverty gives a geographical presentation of the most disadvantageous places in Poland, and thus where priority should be given for energy poverty alleviation.
2.1. Linear and Lasso Regression Analyses
Our estimation of energy poverty prevalence in Poland is based on two assumptions. We believe that energy poverty in Poland is invisible due to (i) households’ extensive use of cheap solid fuels and waste that lower energy costs, the consumption of which is not easy to track in the statistics; and (ii) coping strategies of the poor to under-consume and save on energy-reducing energy expenditures. To compute the necessary energy costs, we follow the standard ordinary least squares procedure and apply multiple linear regression. Our formula includes many variables that reflect housing energy efficiency and households’ energy needs. The linear regression equation is as follows:
where Y is an vector of an output variable, is an matrix of input variables, is an m-dimensional vector of coefficients, and is a vector of random error or noise. To solve the problem of variables selection and keep the best set of predictors, we use a method proposed by Tibshirani [28], i.e., lasso (the least absolute shrinkage selection operator), in which the sum of squares of residuals is minimized, constraining the parameters:
where is a tuning parameter that decides on the amount of regularization, is the -norm, and is the -norm. Lasso regression is used as a robustness check of the results obtained in regular multiple linear regression analysis.
2.2. Principal Components Analysis
To retain the most valuable information on factors of regional vulnerability to energy poverty, we transform the selected BDL data following principal components analysis (PCA). This method is frequently used in energy poverty studies, where a dimension reduction of large datasets is performed to minimize the loss of information [8,29,30].
The principal component is a well-known tool described previously [31,32] and used in newly developed methods; for example, ridge regression [33]. PCA reduces the number of possibly correlated variables to a smaller set of variables called principal components. A fewer suite of linear data combinations is more interpretable given the absence of pairwise correlations between variables. The first principal component (Y1) is a linear combination of variables (X1, X2, … Xd) that accounts for the maximum variation. Y is given by:
The respective matrix notation is as follows:
The second principal component (Y2) is orthogonal to Y1. The following principal components account for the remaining variation. The sum of squared coefficients (α) in each principal component equals 1 (), whereas the correlation between components is zero, corresponding to the orthogonal nature of principal components.
The computation of the coefficients of the principal components is based on eigenvectors and eigenvalues of the variance-covariance matrix. PCA could also be seen as a rotation of the original axes of variables to a new coordinate system with principal components on it.
PCA does not require distributional assumptions in descriptive analysis, making it a universal tool [34]. Although PCA provides a simplified description of the data, the new variables could be less interpretable. The meaning of the new dimension always requires some scientific intuition and common sense. The statistical analysis was performed in R.
3. Data Description
We use two datasets collected by the Central Statistical Office in Poland (in Polish Główny Urząd Statystyczny, GUS). The first dataset is the cyclical module of the Household Budget Survey, focused on the energy consumption by households in Poland in 2018. The survey is conducted every three years, and the latest update was done in 2018. This dataset is designed to capture the energy needs of households; energy expenditures; sources of energy for home- and water heating; cooking; agricultural activities; energy appliances; passenger cars; energy saving; and self-generation. The EGD dataset comprises of 4081 observations represented by heads of Polish households. The EGD includes about 11% of households from the HBS sample. To assess hidden energy poverty in Poland, we select 13 variables from the EGD, complemented with 10 variables from the HBS. The list of variables is provided in Table A1. Based on a set of home’s and household’s characteristics, we can estimate the required energy consumption and compute the after-energy-costs disposable income. The energy poverty cut-off is set at 60% of the after-energy-cost disposable income’s national median value. This cut-off mirrors the relative poverty line adopted by Eurostat [35].
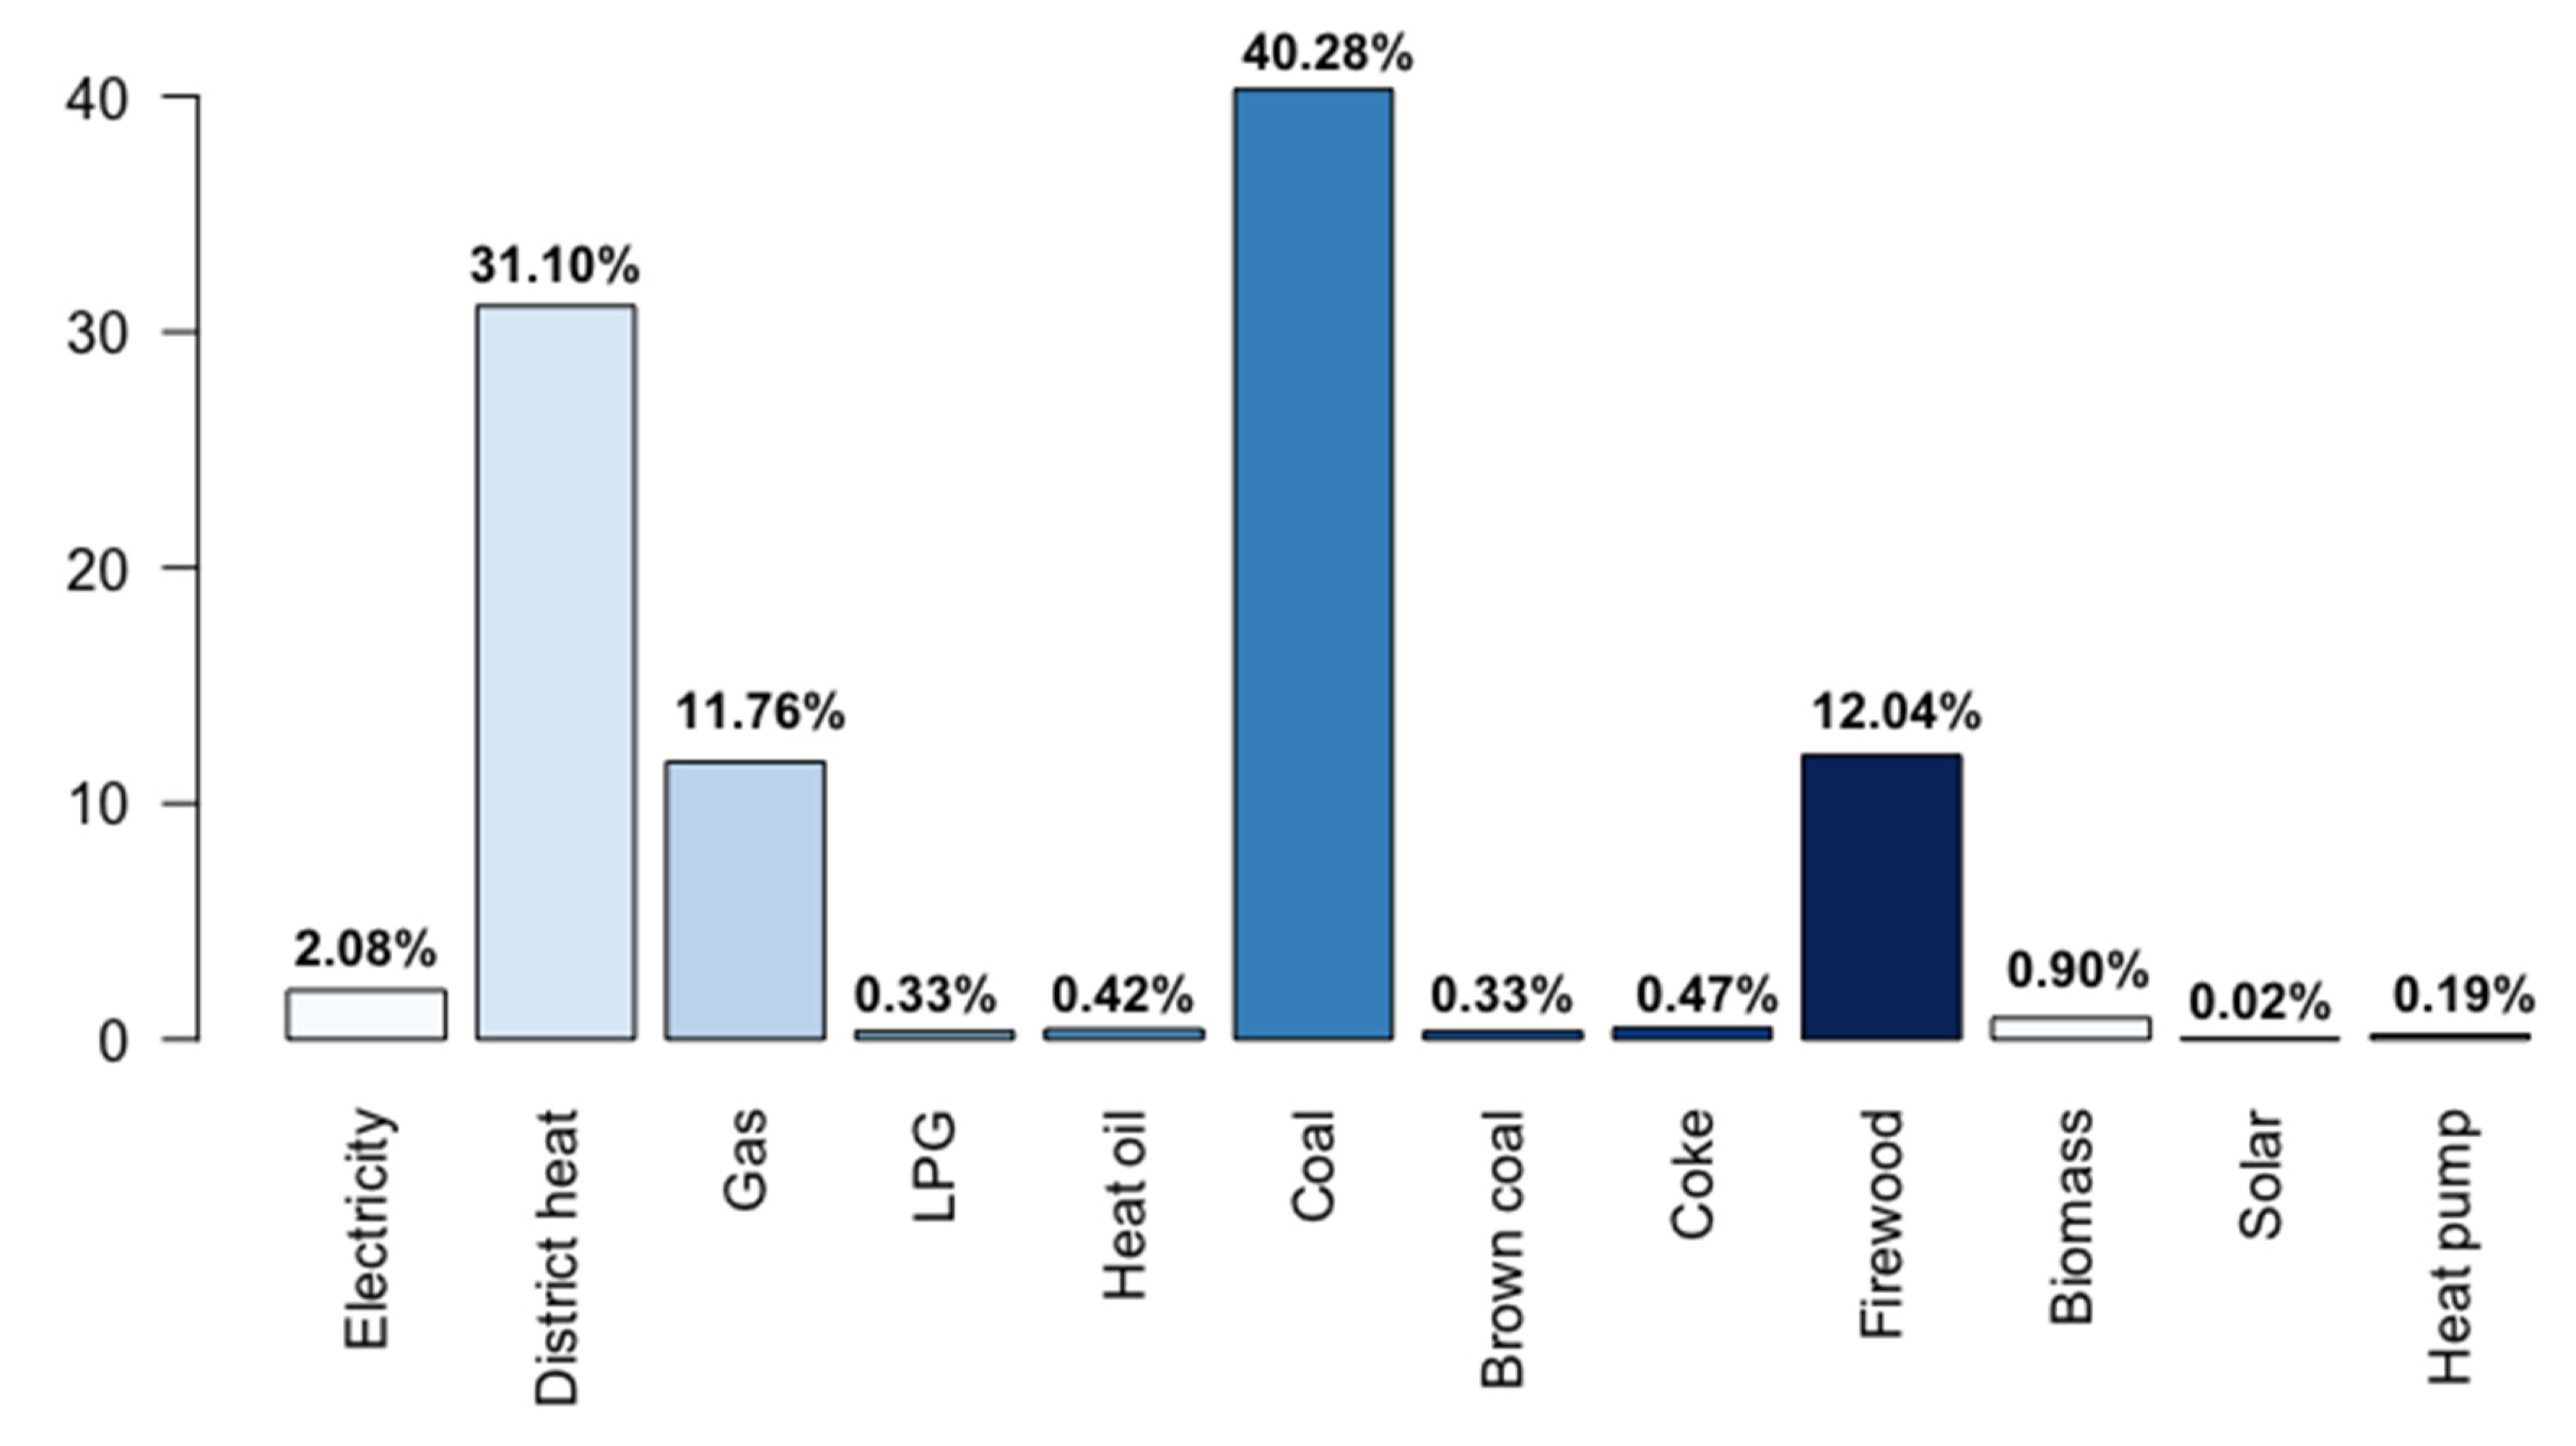
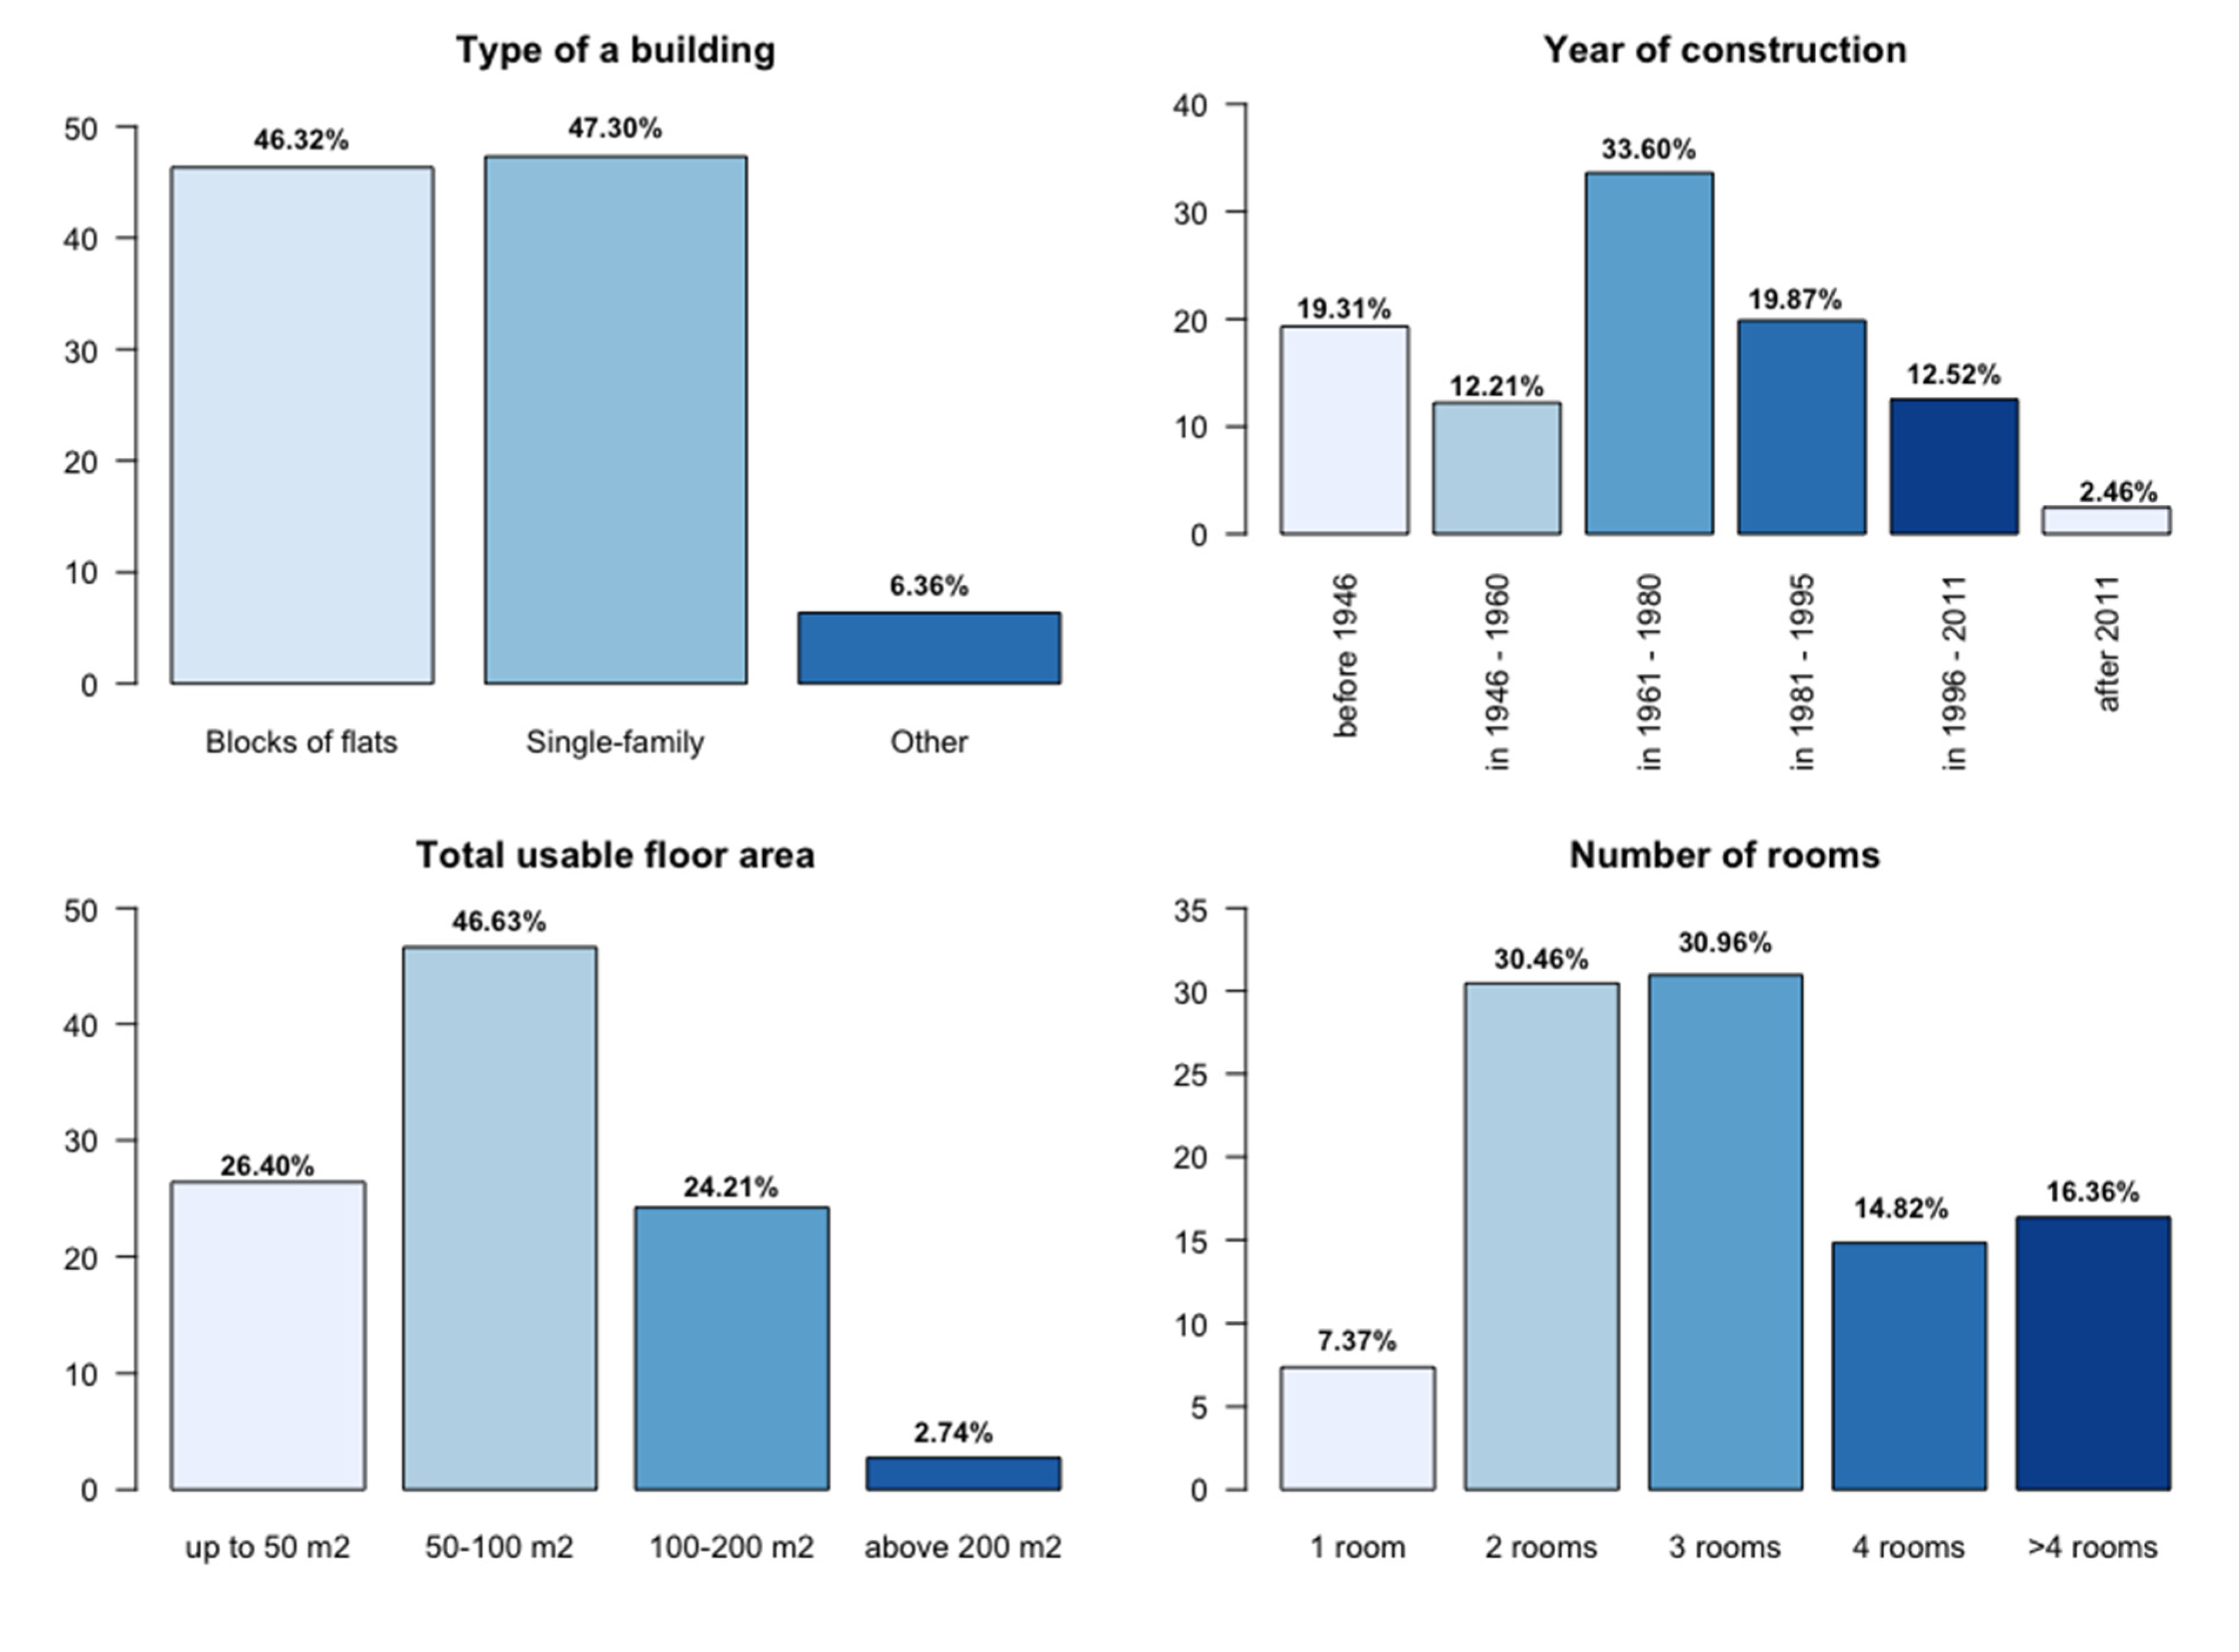
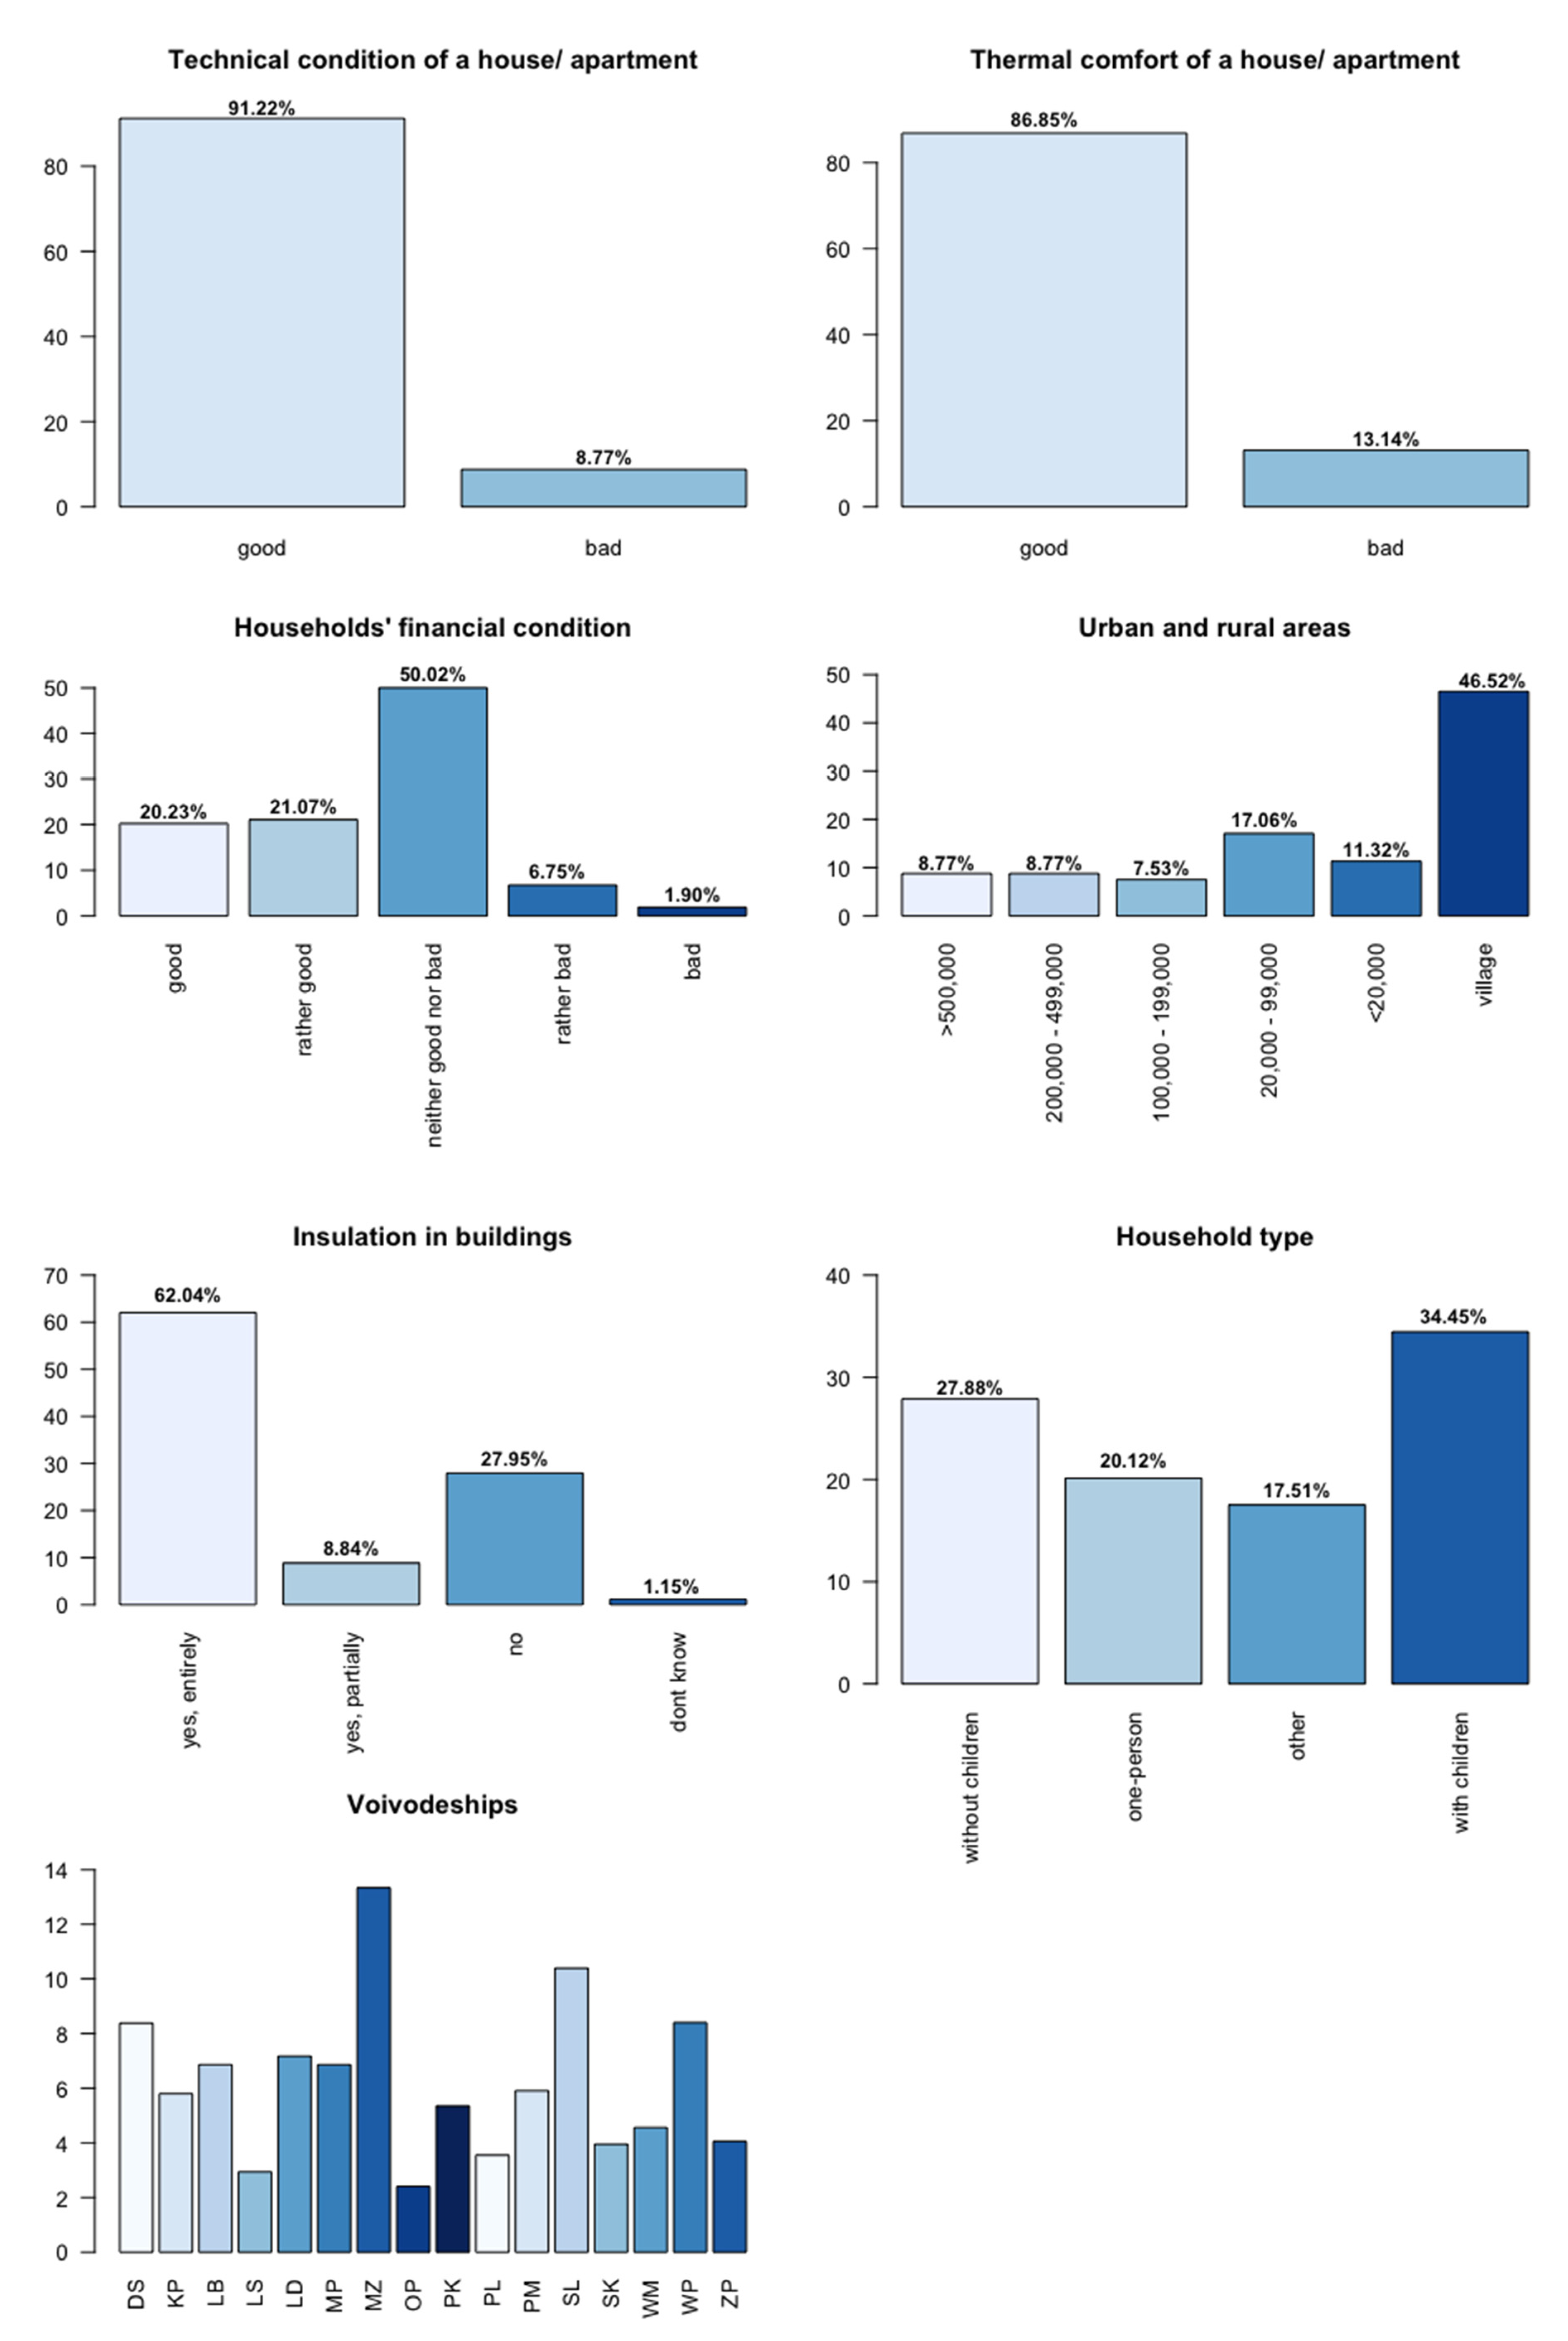
The description of categorical and continuous variables is presented in Figure A1 and Figure A2 on the Annex. Preliminary statistics show that the sample contains almost the same proportion of households living in detached houses and apartments, most built between 1961–1980. The most frequent are 50–100 m2 dwellings with 2–3 rooms. Per respondents’ estimation, homes are in good technical condition and are comfortable in winter and summer. Households from rural areas predominate in the sample (46.52%), most having dependent children. More than 40% of households reported good or rather good financial conditions. On average, households spent PLN 3889 (around EUR 850) on energy bills in 2018, constituting almost 7% of the average annual disposable income. Figure 1 shows the primary sources for homes’ space heating in Poland. Solid fuels have the largest share, amounting to more than 50% of all sources, with coal being the most demanded source (40.28%). District heating represents only one-third of all energies.
The third dataset is the Local Data Bank, which is one of the most comprehensive databases that contains information for all administrative units in Poland on different subjects, such as economics, environment, and society. We chose the second-level administrative unit, i.e., district (in Polish, powiat). There are 314 land districts and 66 city districts in the country, with a total of 380 district units.
We include socioeconomic factors that determine the ability of a district to resist unfavorable conditions, specifically to counteract energy poverty. The vulnerability factors are widely discussed in the literature on energy poverty [8,19] and vary depending on the availability and relevance of data. In the case of Poland, we focus on the following set of indicators. First, respiratory diseases serve as a proxy of poor air conditions triggered by low-stack emissions from the residential sector. At risk of pollution are households that use solid fuels themselves, and those that live in areas where a significant fraction of households use such fuels. This variable also approximates the age distribution of the population. Second, people in post-productive age and social benefit recipients usually spend more time at home and, as a consequence, need more energy to heat their homes.
Third, single-family houses usually cost more to maintain and retrofit, require more energy to heat, and have limited access to a district heating or a gas grid as alternative energy sources. Fourth, the average monthly salary points to the standard of living in a district. Fifth, population density is related to the infrastructure capacity of a district, as well as energy consumption requirements. Sixth, rent arrears indicate the ability to afford to live in a certain apartment or a house.
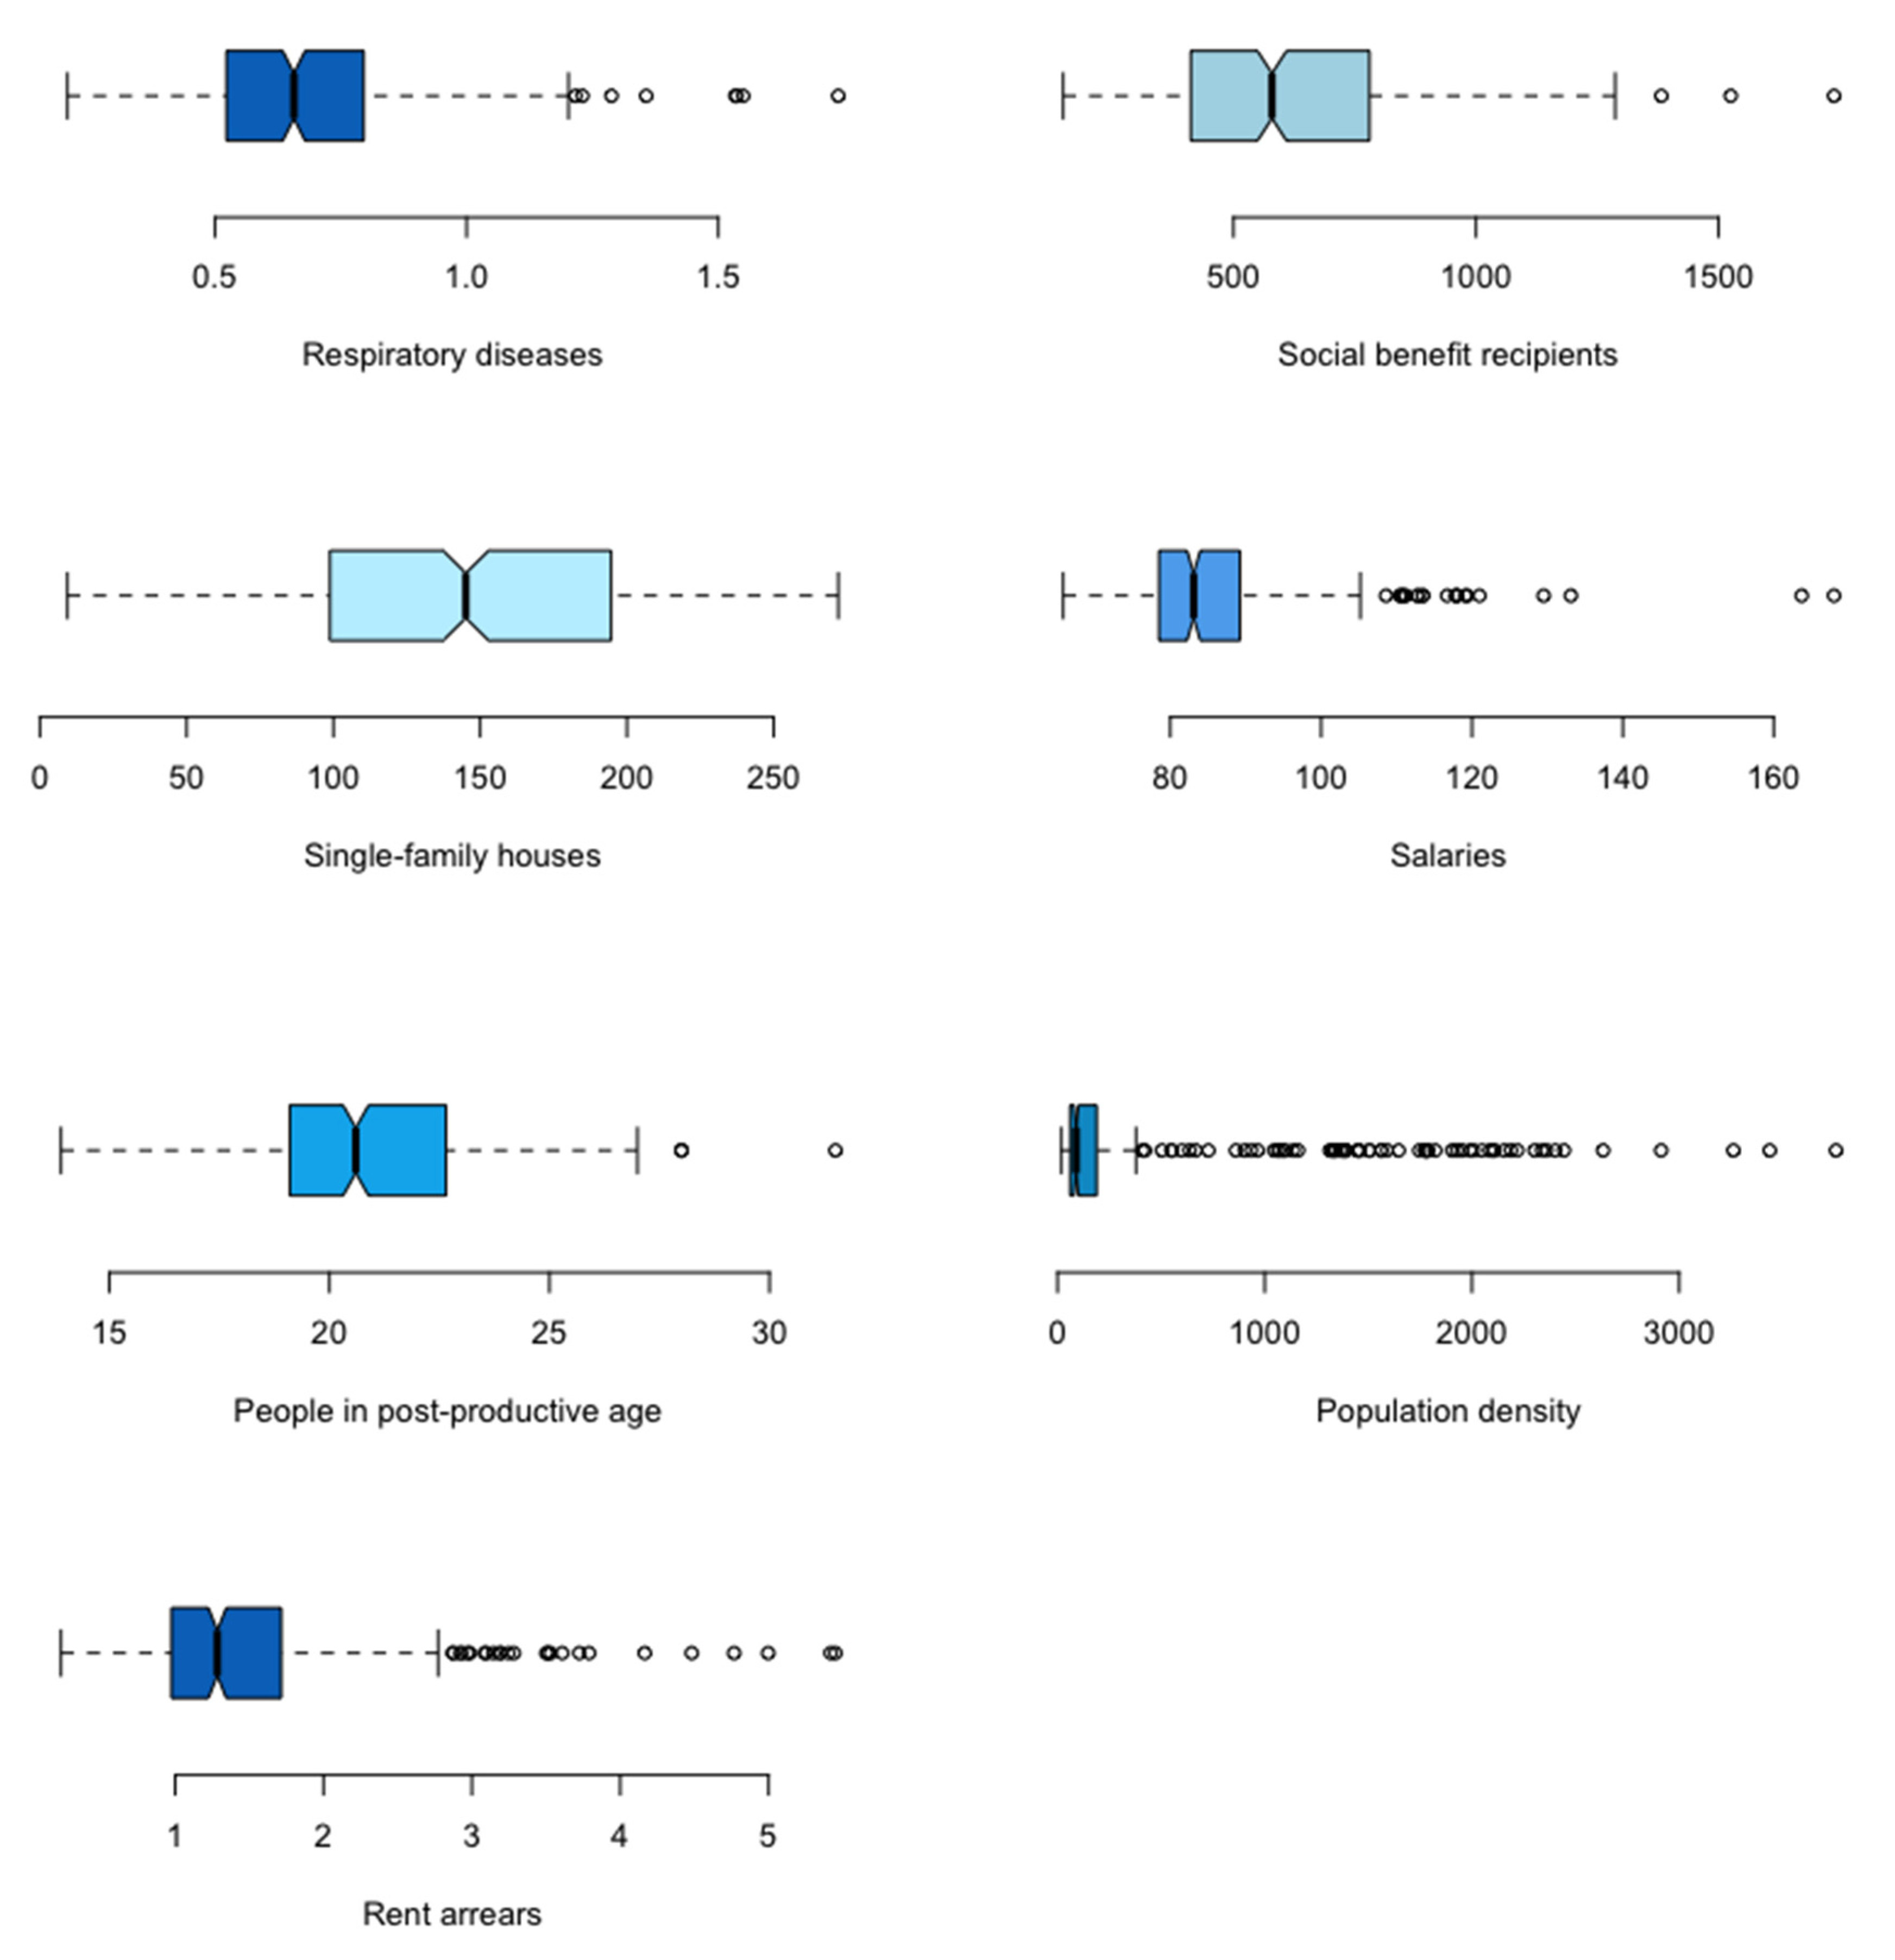
The variables from the BDL are presented in Table 1. Most of the indicators were collected in 2018, except respiratory diseases (2019) and single-family houses recorded during the last census in 2011. The preliminary analysis shows that districts in Poland differ a lot in terms of their capacity to reduce energy poverty. The distribution of population density, salaries, and rent arrears variables are characterized by numerous outliers in the upper tail of distribution, as presented on boxplots (Figure A3). The best-paying jobs are traditionally found in coal mining districts on the south and large agglomerations (Warsaw). We observe the highest amount of late housing payments in some districts in Śląskie region. The largest number of detached houses is noted in the eastern and central Poland districts; the recipients of social benefits concentrate in a few districts in Kujawsko-Pomorskie and Warmińsko-Mazurskie regions; while the lowest number of respiratory diseases is recorded in some districts from Lubelskie and Świętokrzyskie regions.
4. Results and Discussion
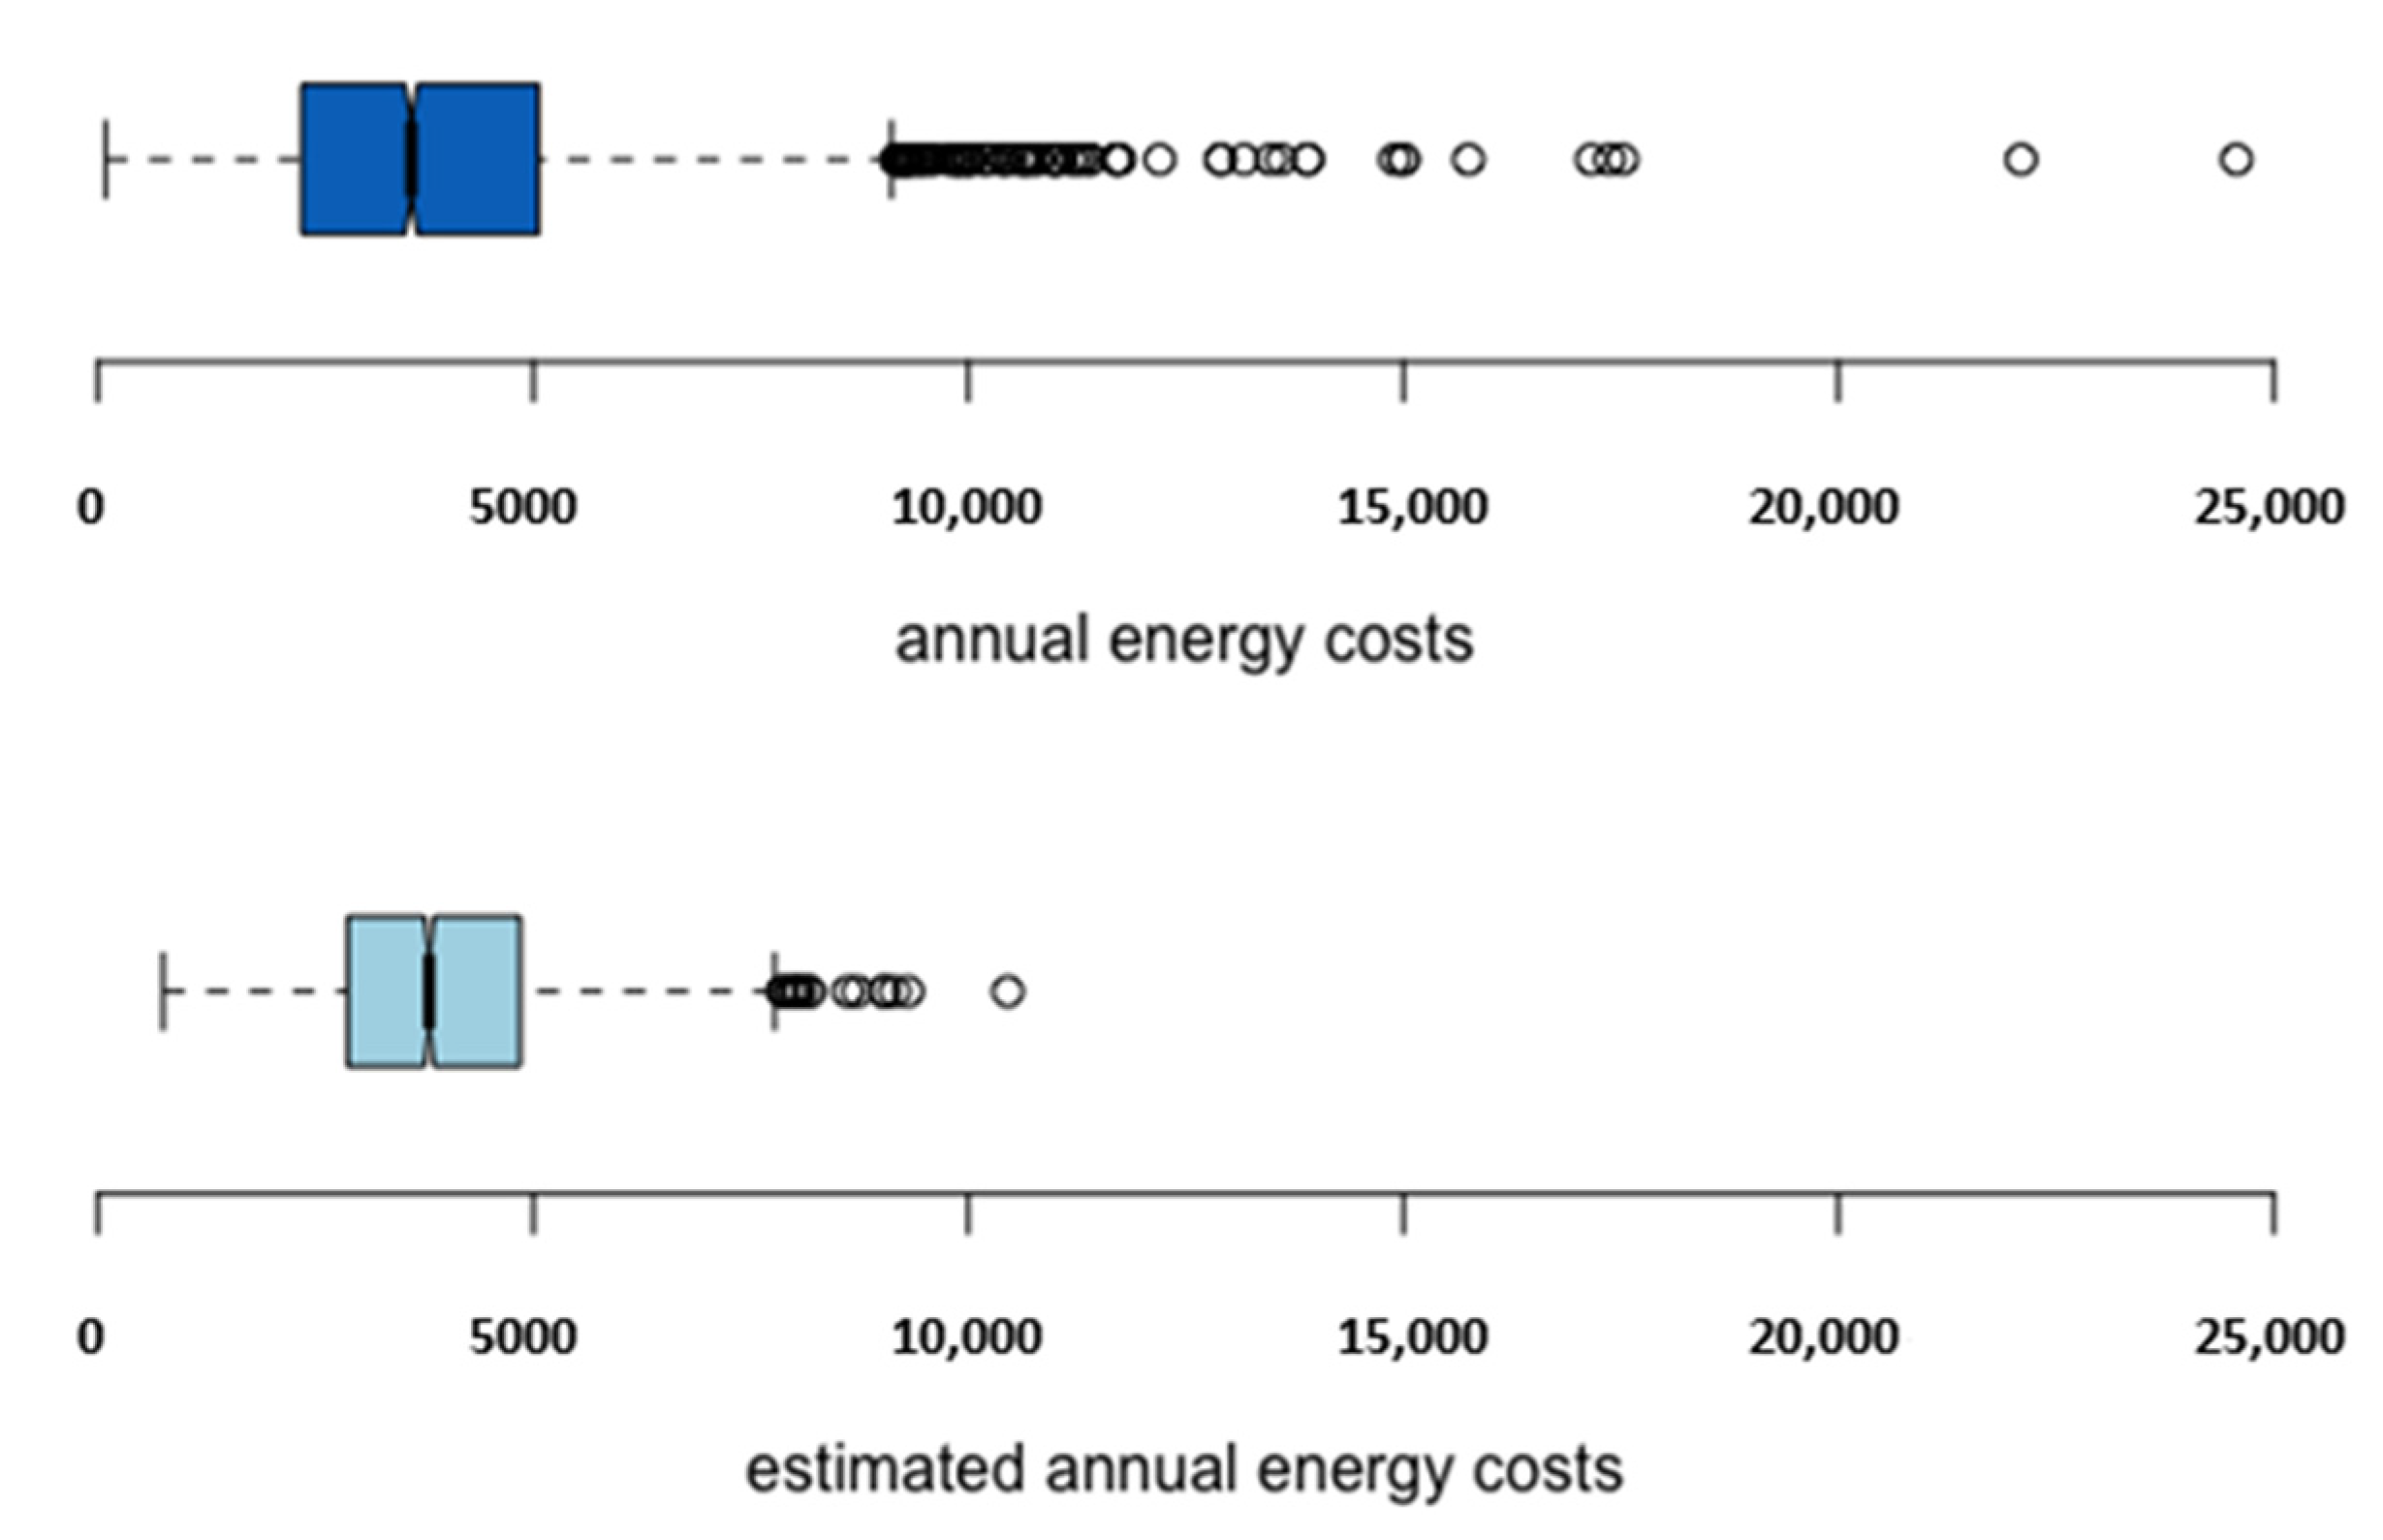
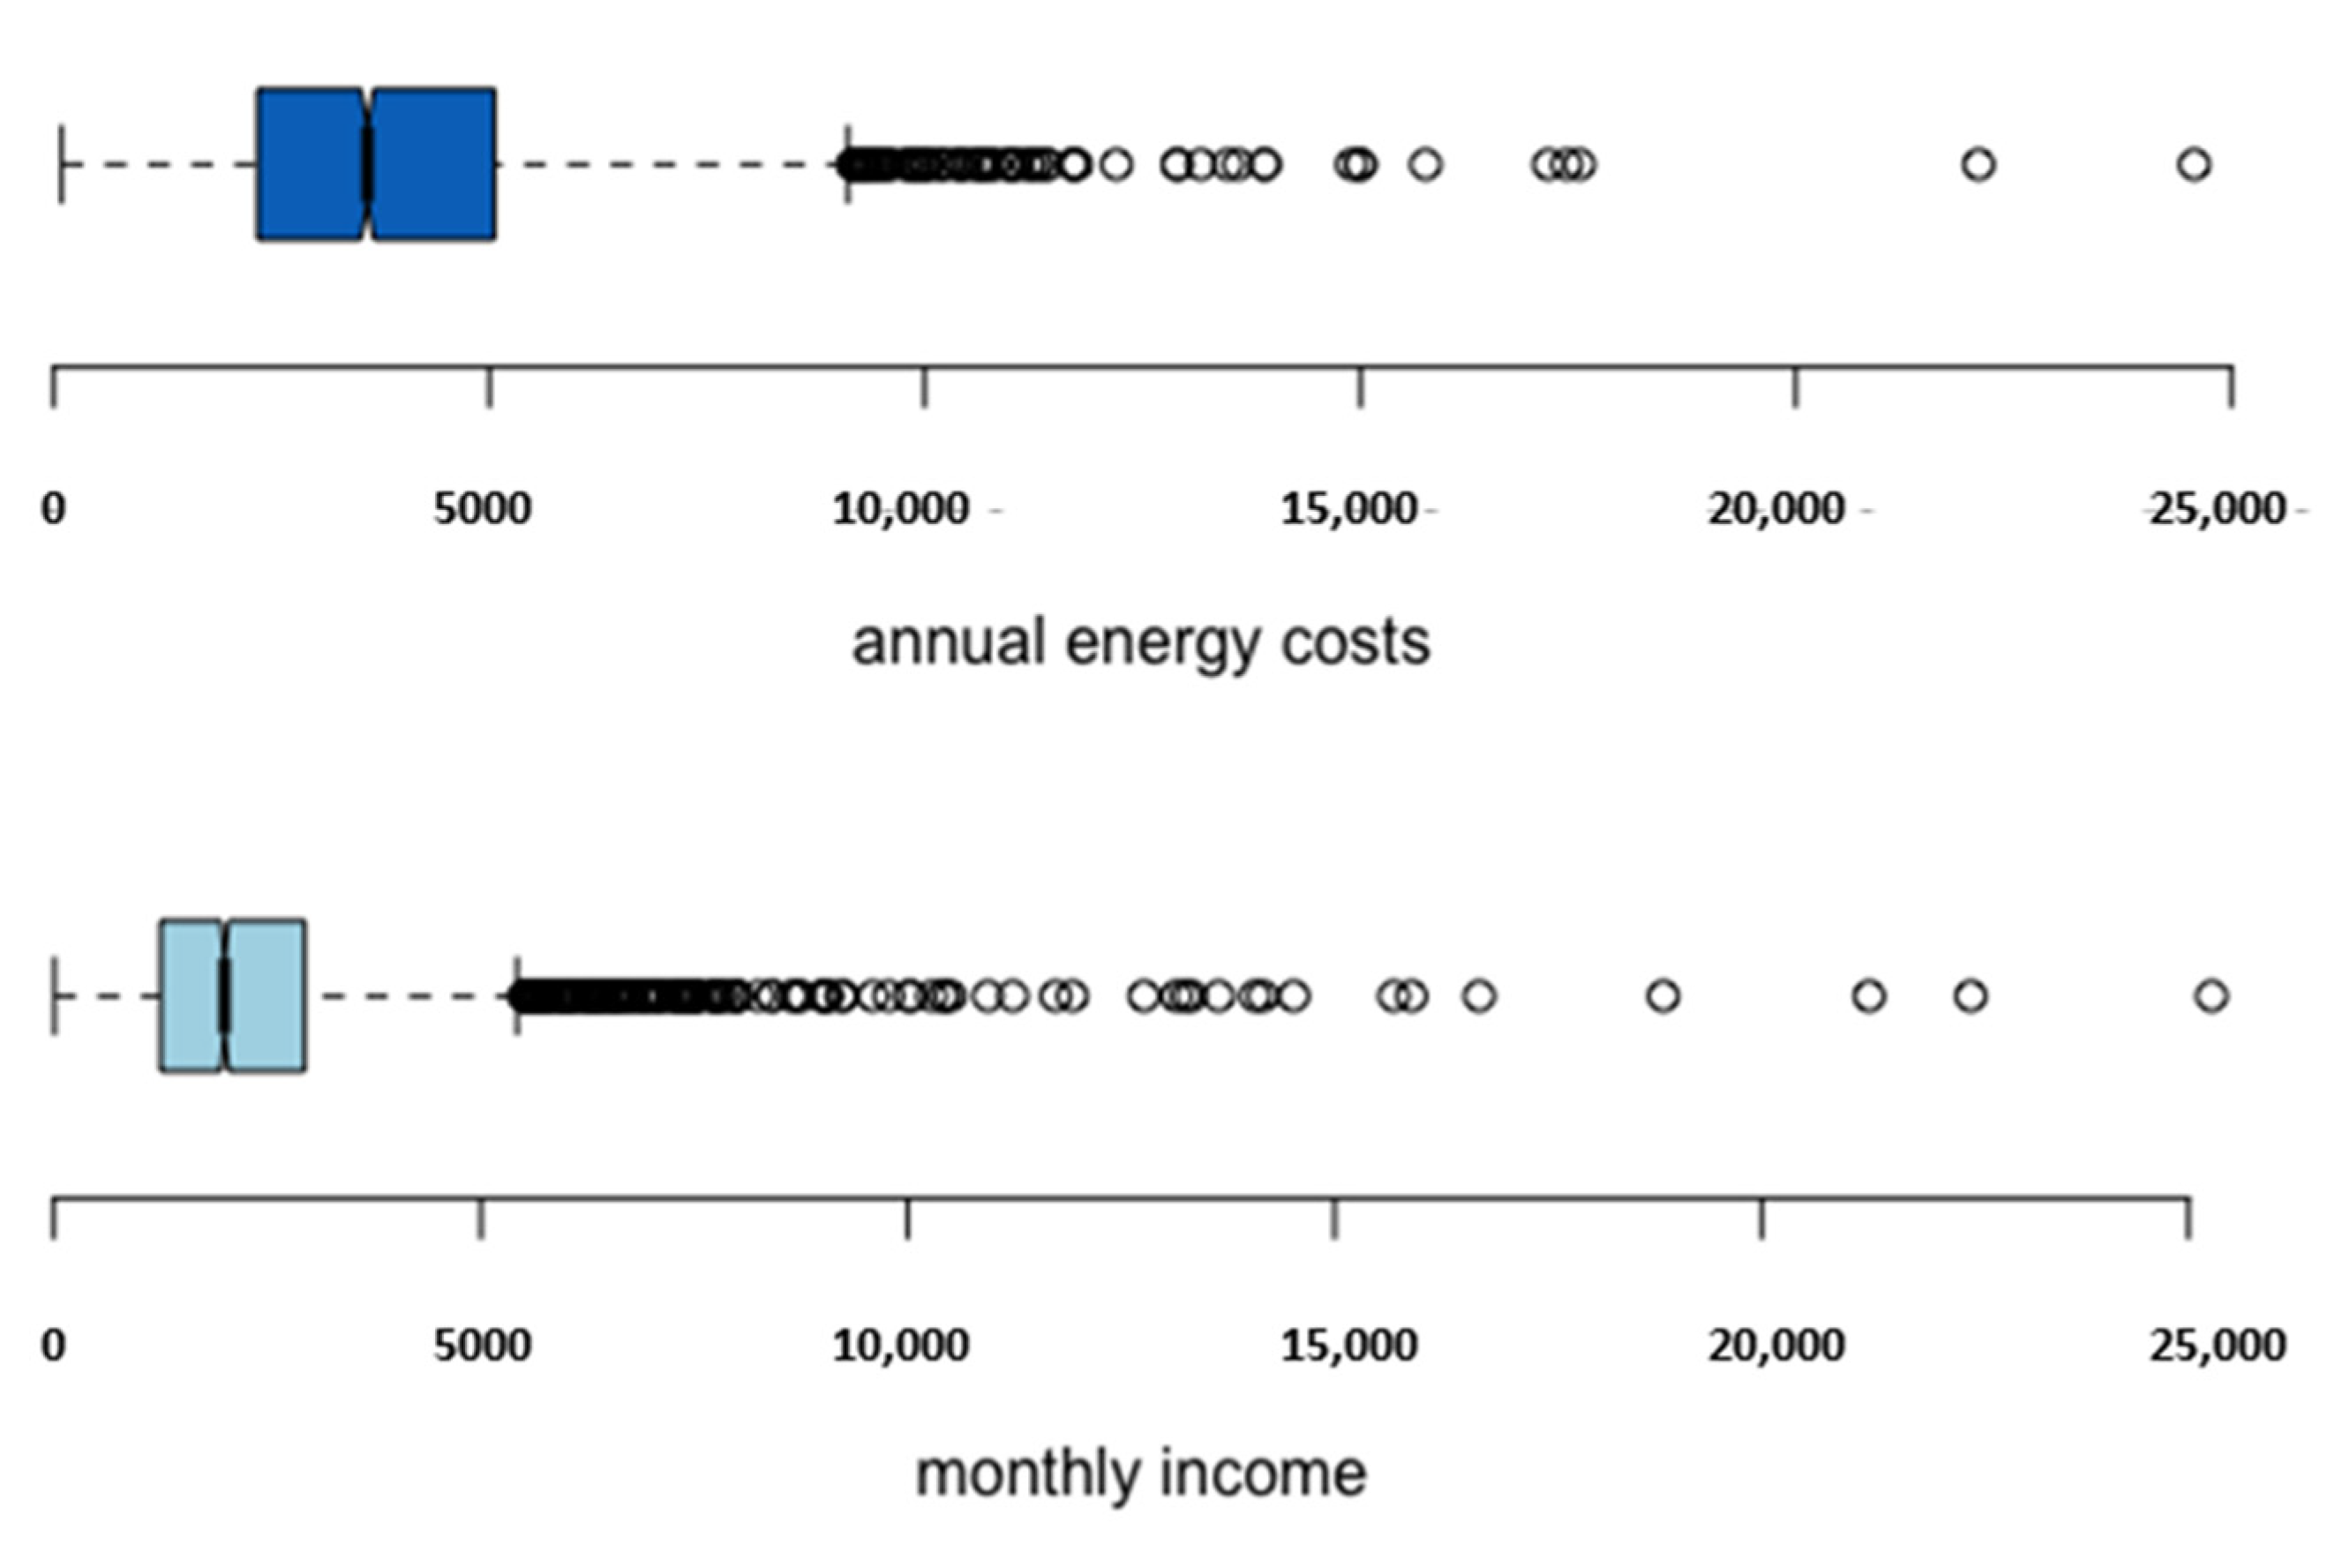
We start by computing the rate of hidden energy poverty in Poland at a household level. To that end, we develop a model to estimate the necessary energy expenditures given households’ and dwellings’ characteristics. The model accounts for factors presented in Table A1 (Annex). If, after subtracting the required for comfortable living energy costs, household income falls below the national median value, a household is classified as energy poor. Our previous findings obtained from the EU-SILC data confirm that about 23.7% of households are at risk of hidden energy poverty [5]. The HBS and the EDG data allow us to compute the energy costs based on a slightly different set of variables. Figure 2 presents the statistics on energy costs obtained in a multiple linear regression model. The estimated interquartile range is narrower, and the lower quartile range is higher than the original, supporting the idea that many Polish households cut on their energy costs, whereas others over-consume energy mainly due to living in energy inefficient homes. The estimated energy costs are then deducted from a household’s income and compared to the energy poverty threshold, i.e., annual after-energy costs’ equivalized disposable income (15,652.16 PLN, i.e., about 3425 EUR).
The rate of energy poverty in Poland covers almost 16.5% of households. As presented in Figure 3a, the most affected regions are Podlaskie (27.5%) and Opolskie (27.3%) regions; and the less affected regions are Zachodniopomorskie (8.9%), Lubuskie (9.5%), and Śląskie (9.7%) regions, in which people have higher salaries either due to tourism, coal mining, or simply because the level of urbanization is relatively high, like in Lubuskie.
The presented map (Figure 3a) is our starting point in the analysis of regional vulnerability to energy poverty (please refer to the administrative map of Poland for the detailed description of all geographical units http://ksng.gugik.gov.pl/pliki/mapa_administracyjna_polski_2020.pdf, accessed on January 2021). Later in this study, we add layers to the original map to see how the energy poverty situation changes due to regional vulnerability socioeconomic factors.
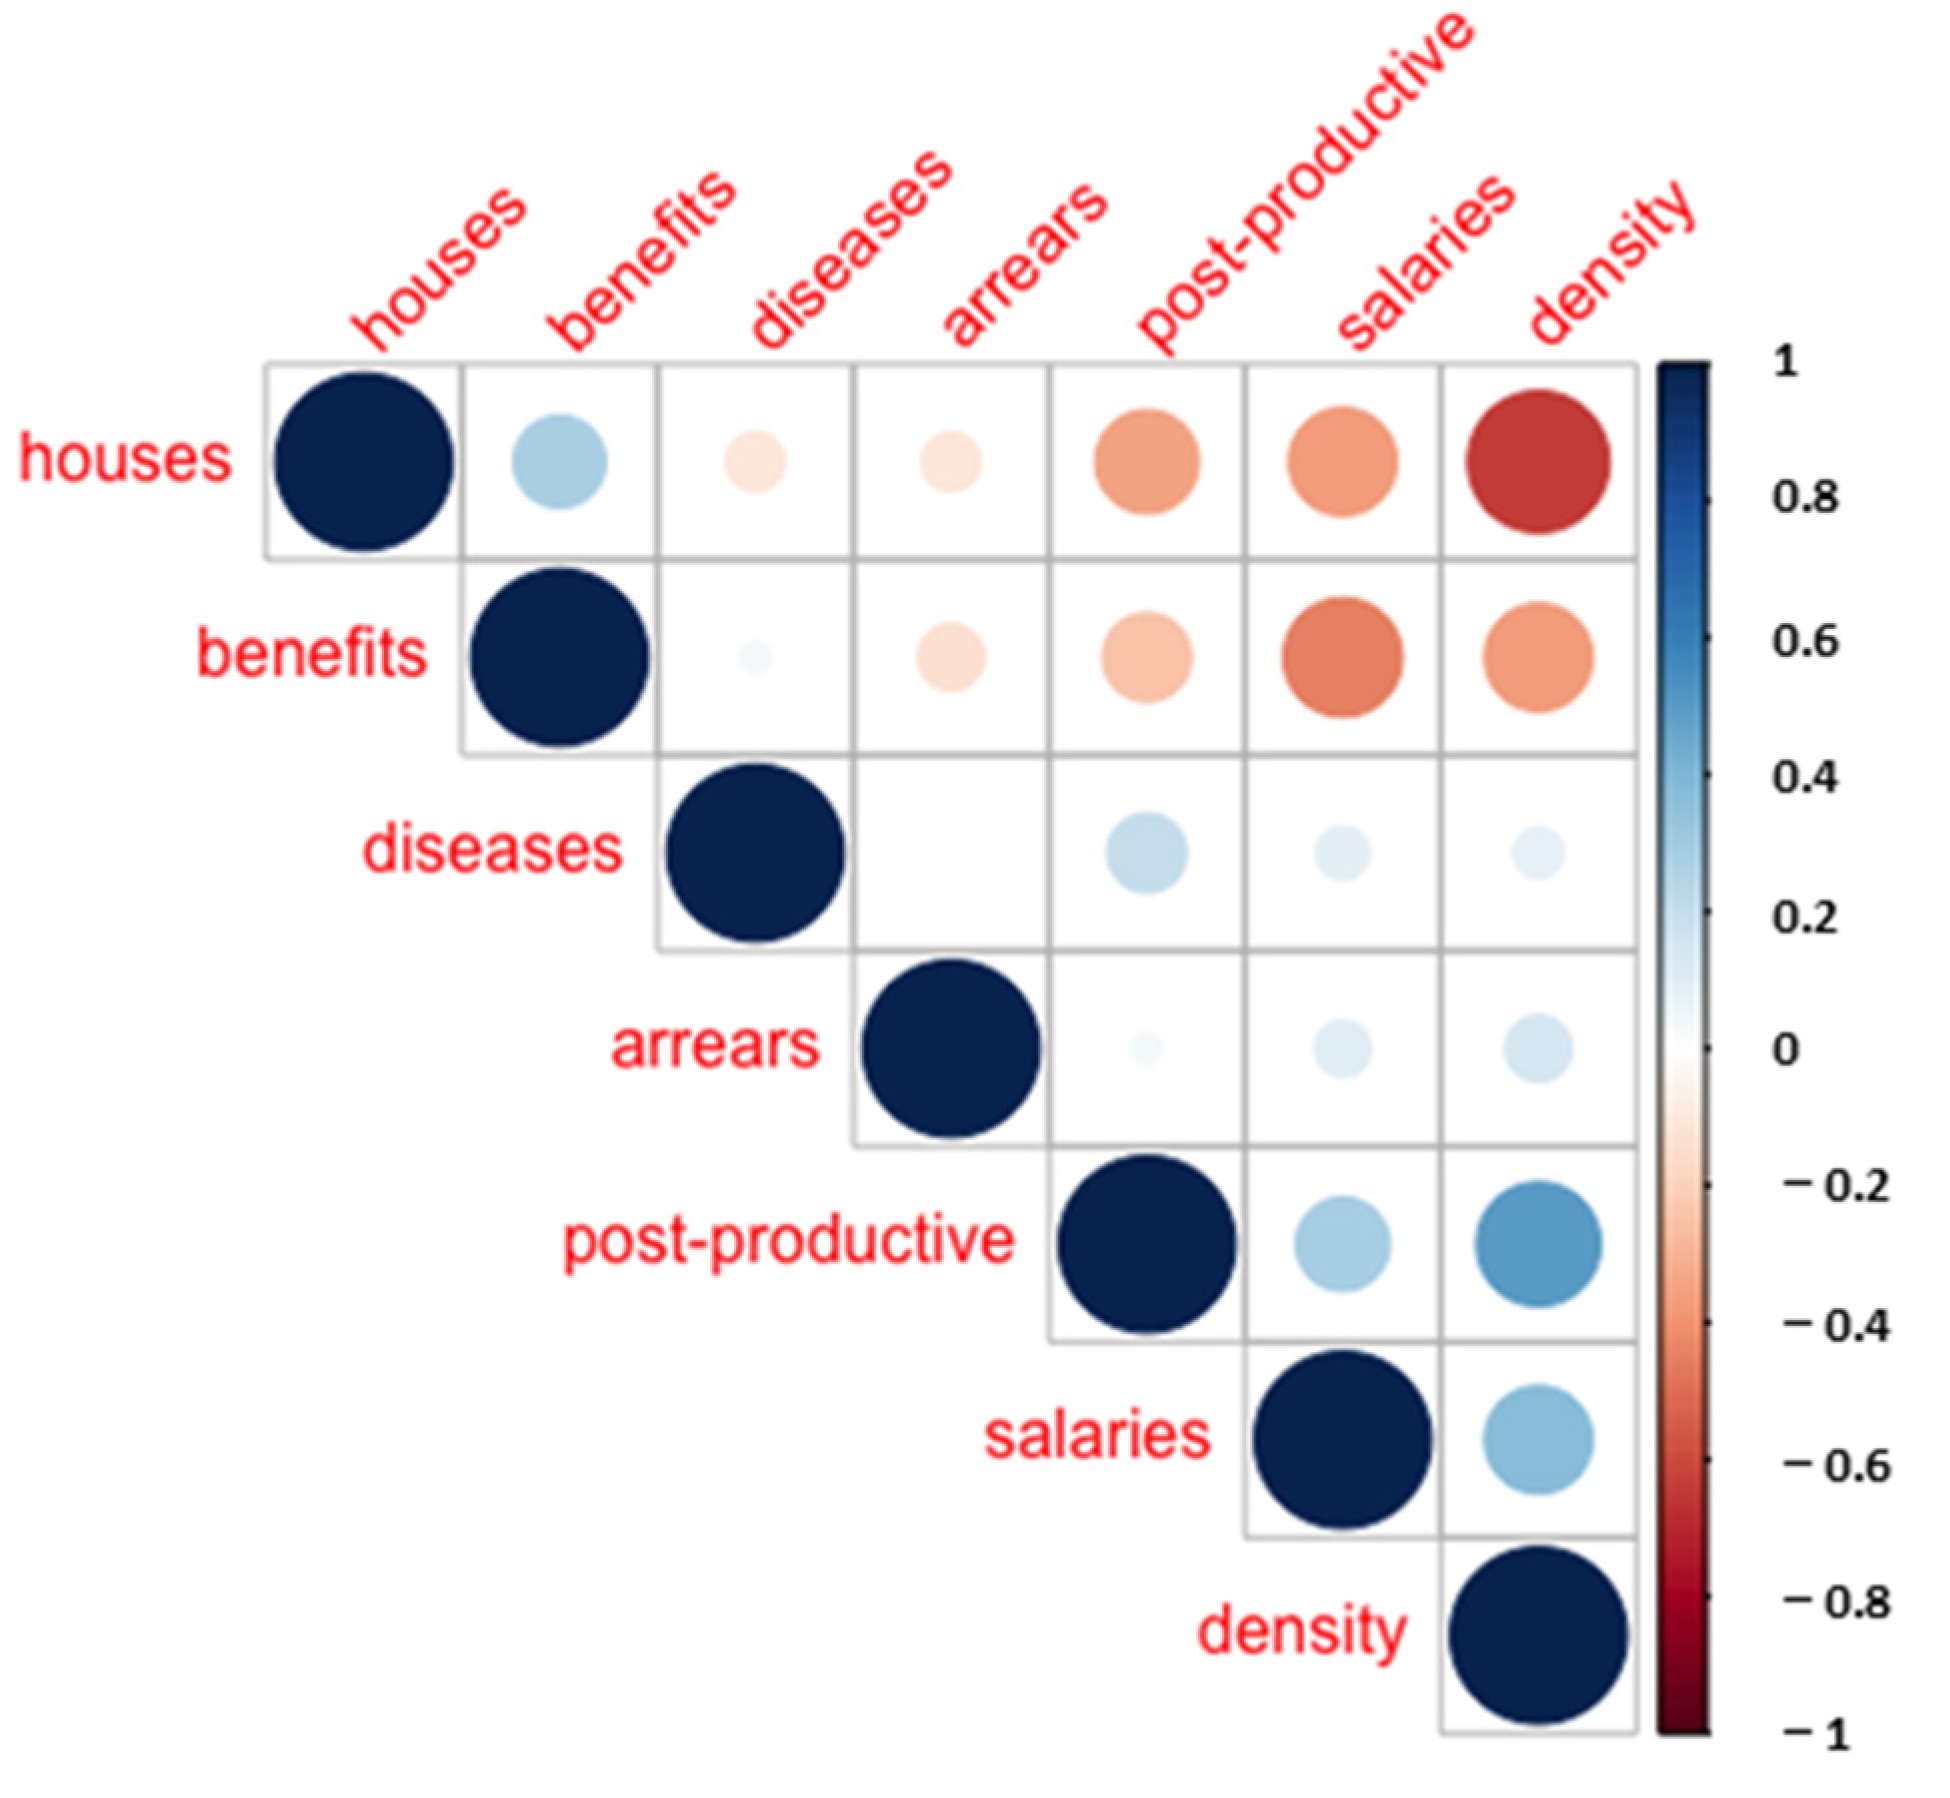
In the second step, we examine factors of vulnerability to energy poverty in 380 Polish districts following PCA, which seems appropriate, taking into account quite a large number of dimensions that our dataset has. To begin with, we look at the visualization of the correlation matrix (Figure 4). The graph presents the correlation between variables, sized from strongest to weakest, and reordered to mirror the direction and strength of a correlation. We notice a positive correlation between density and post-productive age, and a negative correlation between houses and density, salaries, and benefits recipients.
In Table 2 standard deviation or eigenvalue shows the variability across a particular principal component; the proportion of variance indicates the variability in the original data explained by principal components. In our case, the first four principal components capture 78.4% of the variability in the data. We decide to retain these first four principal components with the eigenvalue close to 1.
Table 3 includes the results of PCA for all seven components. The first component is the only component related to all variables. In the first component (PC1), variables population-density and single-family-houses have the most significant positive and negative loadings, respectively. PC1 divides regions by the degree of urbanization, i.e., less populated rural areas, where detached houses prevail; and densely populated areas, such as Gdańsk, Łódź, Wrocław, Warsaw, etc. This component is less informative in the matter of regional vulnerability to energy poverty. Yet, single-family houses are more demanding in terms of energy consumption and investments in energy efficiency renovations. These houses are also the focus of the Stop Smog program [2], designed to help energy-poor households in Poland.
Respiratory diseases and rent-arrears contribute the most to the second component (PC2). It is worth noting that rent-arrears are negatively correlated with PC2, while social-benefit-recipients are positively correlated with PC2. This component describes the situation of owners living in rural or less urbanized areas and not paying rent. In this case, even the energy poor will not have rent arrears. According to PC2, regions are distinguished as to the level of respiratory diseases and the number of elderly people reliant on state aid.
The third component (PC3) allows for a deeper understanding of regional vulnerability to energy poverty. The factor loading is positive for rent arrears, respiratory diseases, social benefit recipients, and the factor loading is negative for salaries. This component captures regions with poor air quality, high rent arrears, and a high portion of people dependent on social assistance. The rent-arrears variable denotes tenants occupying multifamily buildings in medium populated areas. PC3 points to regions unable to resist the stress associated with energy poverty, as there are already problems with supporting the population’s wellbeing. Consequently, this factor further aggravates problems of household energy poverty.
The fourth component (PC4) divides regions concerning positive values of social benefits, population density, and people in post-productive age, and negative values of salaries, single-family houses, and respiratory diseases. This group of regions resembles suburbs of large agglomerations, where population density is still high, but air quality is not bad, most probably because there are not so many single-family houses, i.e., important contributors to air pollution. There are many retired people who occupy blocks of flats in the districts identified with PC4.
PC4 points to disparities in the socioeconomic growth of some cities that belong to so-called Poland A and Poland B [39], i.e., more and less developed areas, correspondently. Positive loadings have some declining cities from Poland B, such as Chorzów, Chełm, Bytom, etc., and negative loadings have neighborhoods of some prosperous agglomerations, including coal mining centers.
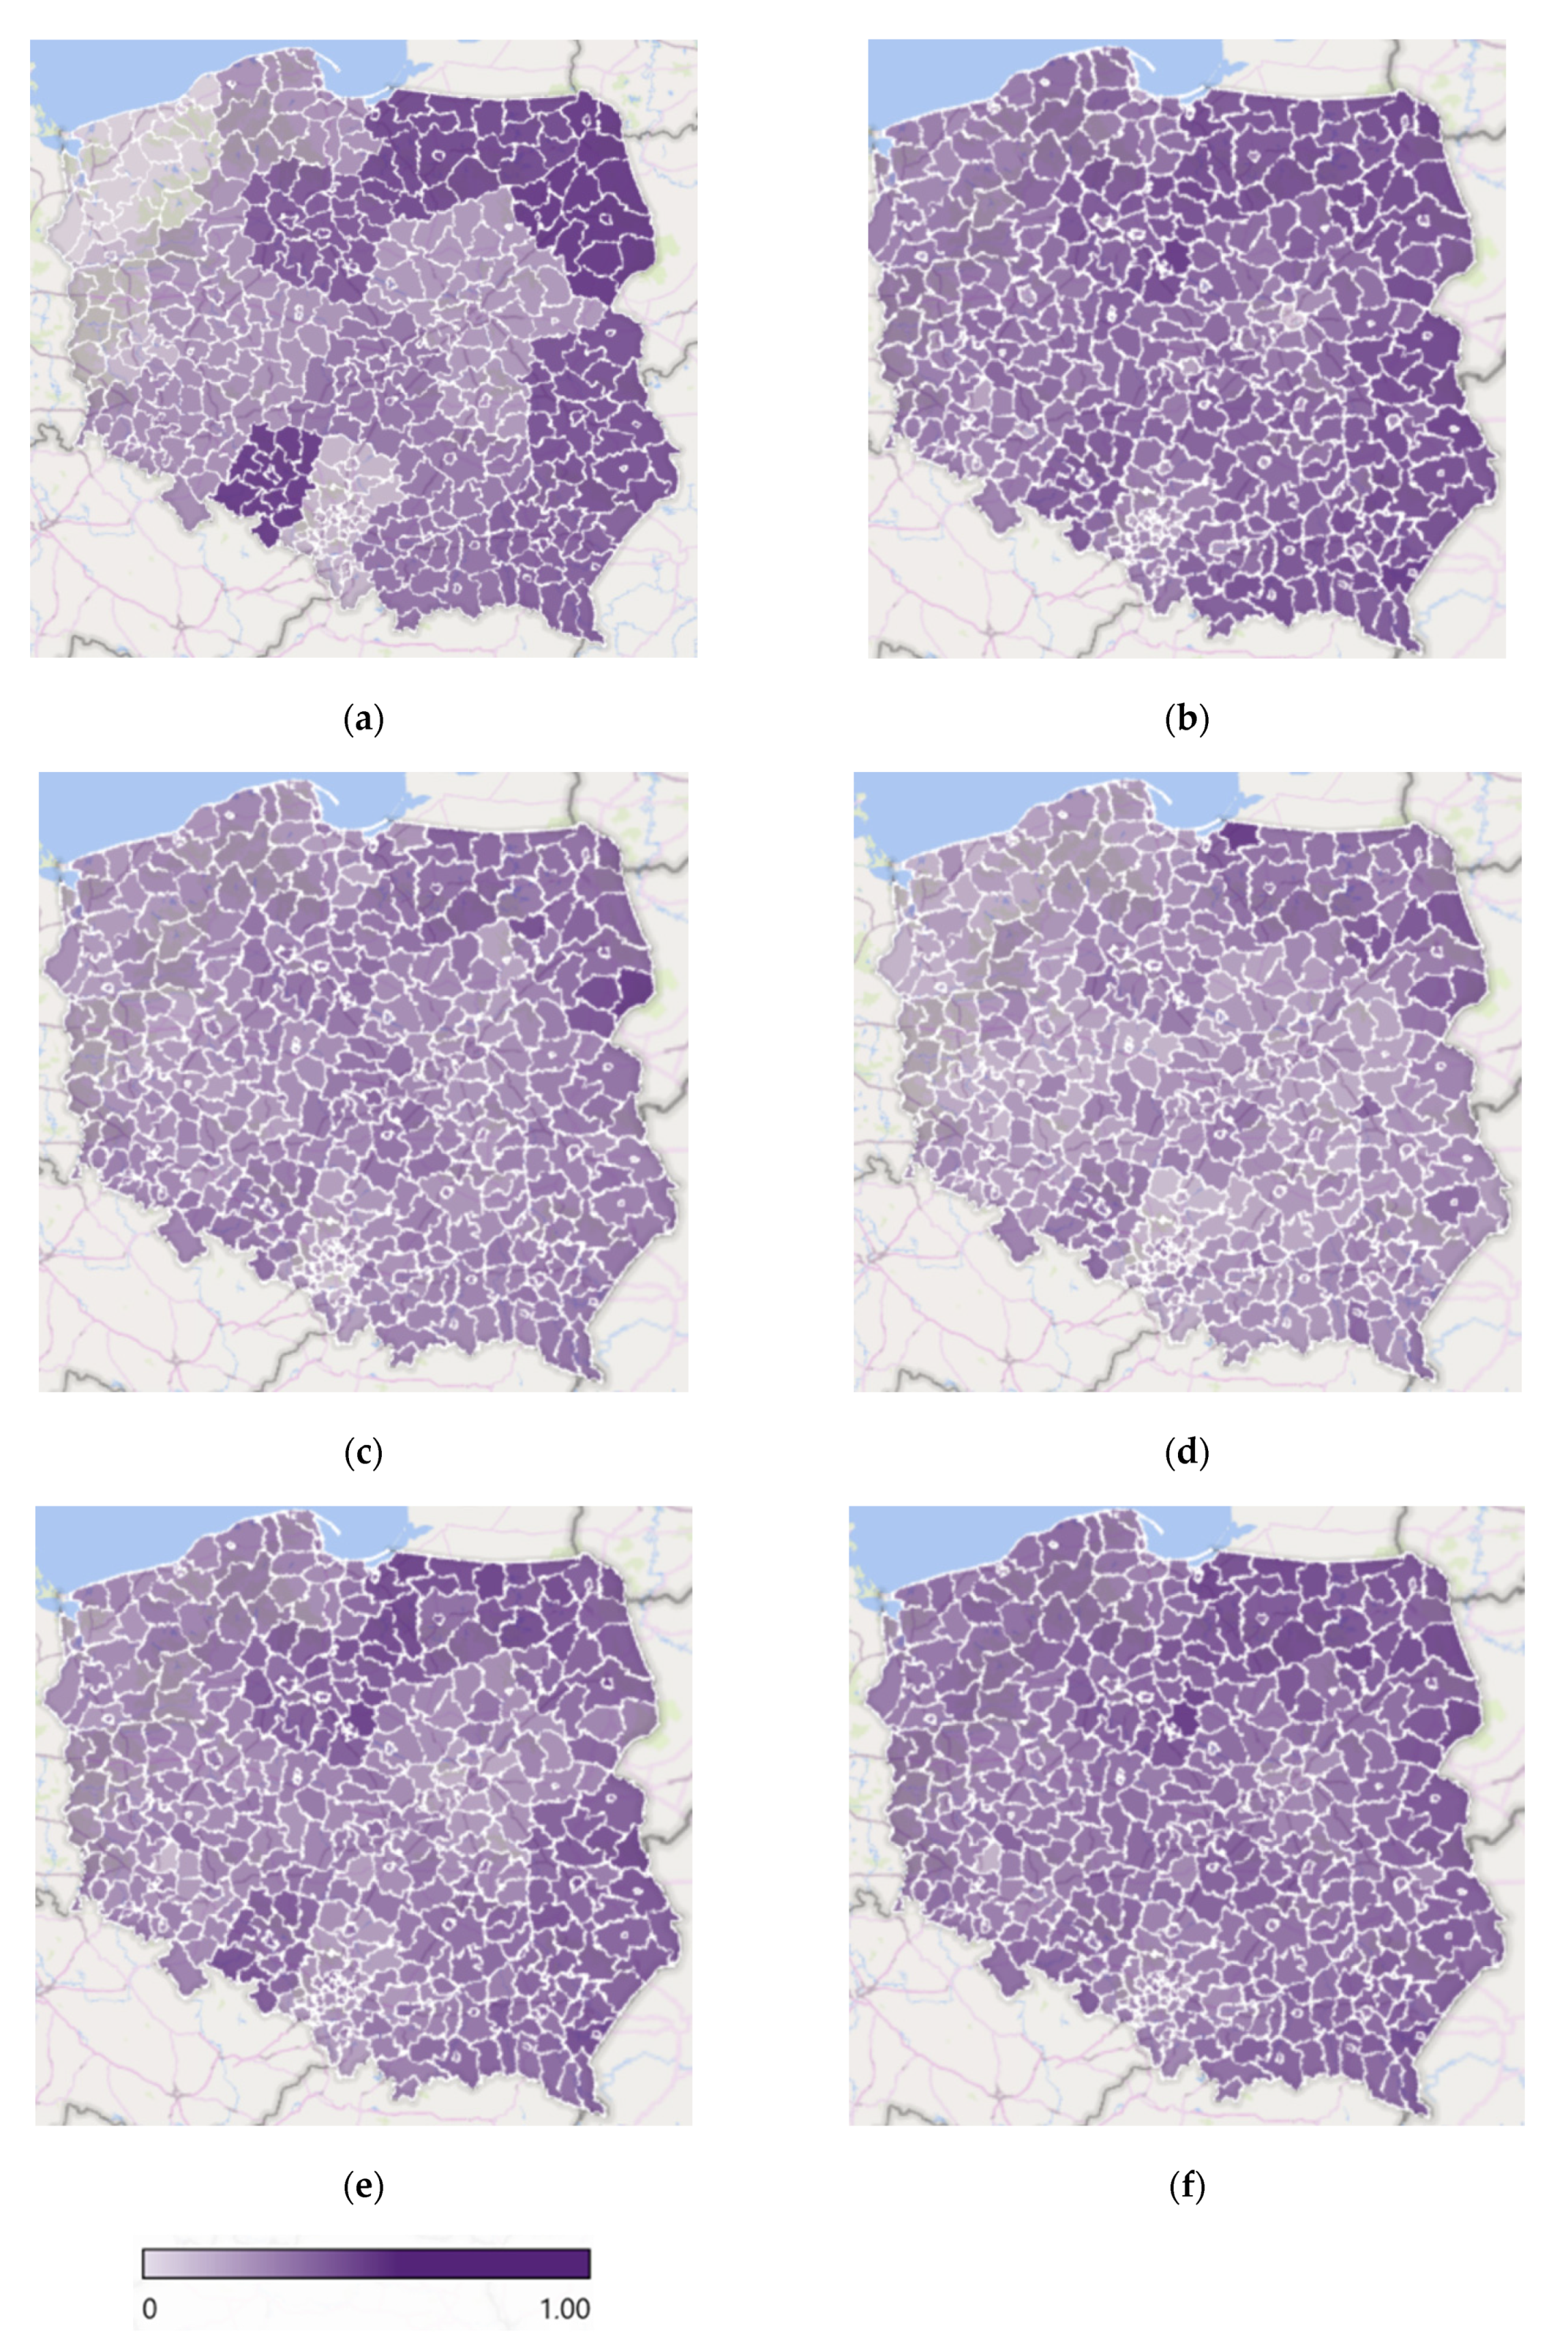
Lastly, we would like to identify vulnerable districts by showing each aspect of regional vulnerability represented by the four components on the map of Poland. The components are modified, so each component presents an increase in vulnerability to energy poverty. We also standardize the values of household energy poverty to put them on the same scale as PC. The first map (Figure 3b) presents the distribution of energy poverty in conjunction with population density and detached houses.
PC2 is added as a second layer to the energy poverty map (Figure 3a). This component calls attention to a vulnerability related to building types and the associated energy needs and efficiency. Overall, living in a rural area makes it more challenging to escape energy poverty [40]. Less urbanized regions with a high rate of energy poverty are relatively worse off than others. Here, we could see that large agglomerations, such as Warsaw, Kraków, and Łódź are excluded, but cities’ suburbs remain vulnerable.
We add the next component, PC2, to the first map (Figure 3a) and obtain a picture of energy poverty in regions suffering from poor air quality and inhabited by people relying on social aid (mostly elderly and retired), as shown in Figure 3c. In this case, energy poverty is aggravated by respiratory diseases and social precariousness. The most affected districts are located in Podlaskie, Opolskie, Łódzkie, and Warmińsko-Mazurskie regions; the less affected are districts in Śląskie region. Other regions are more or less homogenous in this regard.
The third map of regional vulnerability to energy poverty (Figure 3d) combines PC3 and household energy poverty information. The map shows districts where people live in blocks of flats and experience problems with paying rent. In addition, inhabitants of these areas earn low incomes and have respiratory illnesses. PC3 distinguishes districts that are resilient to energy poverty despite its high rate. There are no clear borders between regions; vulnerable districts could be found in Warmińsko-Mazurskie as well as in Małopolskie regions.
Figure 3e shows the PC4 layer on the energy poverty map (Figure 3a). This map corresponds to regional vulnerabilities associated with the number of elderly people living in the outskirts of large cities or small towns, with limited opportunities to earn good salaries. PC4 highlights vulnerability related to the dynamics of economic growth of medium-sized cities in Poland B, compared to the suburbs of the largest cities in Poland A.
The final map (Figure 3f) is a combination of all regional vulnerabilities and household energy poverty. Some districts are more vulnerable even though the level of energy poverty is the same in the whole region. We could localize areas that require the special attention of policy-makers. These are districts in Kujawsko-Pomorskie, Podlaskie, and Warmińsko-Mazurskie regions. The better-off districts are primarily located in Śląskie and Mazowieckie regions.
To overcome this problem, a complex approach is required. A substantial overlap of factors increases regional susceptibility to energy poverty. For example, air quality is a target of environmental policy; population precariousness is in the focus of social policy; and poor thermal comfort of buildings is the primary concern of energy policy. However, all mentioned policies contribute to energy poverty alleviation and should constitute a concerted action.
5. Conclusions
This study attempts to assess the vulnerability to energy poverty of 380 Polish districts based on seven indicators from the Local Data Bank. The selected variables capture socioeconomic aspects of districts’ wellbeing related to energy poverty. We apply the following logic in our research. In the first step, we estimate regional household energy poverty, developing a model to compute the required energy costs and a procedure to identify the energy poor afterward. We set the energy poverty threshold at 60% national median after-energy costs equivalized disposable income. According to the results, about 16.5% of households in Poland are in hidden energy poverty. The identified households either consciously under-consume energy, or save on energy costs by burning cheap solid fuels. The distribution of the results across regions shows that the rate of energy poverty is the highest in Podlaskie (27.5%), and the lowest is in Zachodniopomorskie (8.9%) regions. To fit the results to low-level administrative units and distinguish districts in Poland, we investigate regional vulnerabilities.
In the second step, we focus on factors that influence the ability of a district to alleviate household energy poverty. Seven socioeconomic indicators associated with energy poverty from the BDL database are chosen. These indicators are respiratory diseases, single-family houses, average salaries, people in post-productive age, social benefit recipients, population density, and rent arrears.
By applying PCA, we found four major dimensions of districts’ deficiencies to counteract energy poverty. The first dimension is associated with the degree of urbanization and building types prevailing in specific locations. The second dimension reveals difficulties of districts, where rent arrears, poor air quality, and elderly populations subsisting on social benefits are dominant. The third dimension is related to areas populated by social aid tenants living in multifamily buildings and having rent arrears. The fourth dimension divides cities into districts with regard to prospects for socioeconomic growth and possibilities to earn a good salary. The combination of all vulnerabilities in conjunction with household energy poverty indicates areas where the situation is the worst. Our maps capture districts all around the country that are vulnerable in one or many respects.
The approach presented in this paper offers policy implications on two levels. Firstly, it disaggregates macro-regions, i.e., provinces, into smaller ones, i.e., districts. More detailed information allows for the precise allocation of targeted funds to areas that are more exposed to energy poverty. In the second step, the effectiveness of these policies can be evaluated to see if there has been an improvement, i.e., a reduction in the exposure to energy poverty. Smaller regions mean potentially smaller losses if the proposed policies are proven to be ineffective.
Secondly, the proposed approach suggests looking at energy poverty in small areas through the lens of other relevant socioeconomic variables. In this way, decision-makers are informed as to what types of deficits are prevalent in each area, allowing them to deliver a more targeted and therefore more effective and less costly tool. Thus, some policies will be directed toward regions where energy poverty is linked to social exclusion, and other policies toward regions where energy poverty is manifested by poor air quality.
Our findings provide information for policy-makers on further optimization of energy poverty policies at the local scale. Specifically, we rely on two ways of energy poverty identification, i.e., model-based identification of energy-poor households and geographical identification of vulnerable places. A cross-section of both methods gives a good direction to decision-makers. Knowing regions where the problem of energy poverty is acute makes policy targeting more precise. Specifically, our results indicate some districts in Kujawsko-Pomorskie, Podlaskie, and Warmińsko-Mazurskie regions, where household energy poverty is exacerbated by a low regional capacity to resist. The evidence we provide is especially relevant in the context of discussions on the failures to identify the energy poor in Poland, who are, at the moment, defined as the poor living in single-family houses in regions mentioned in the Stop Smog program [2]. As unfolded by this research, this definition used by national polish authorities does not capture all possible manifestations of energy poverty.
Possible directions for further research include the analysis of regions’ vulnerability to energy poverty at the lowest administrative level, i.e., municipality (in Polish, gmina.), which will allow for the construction of a high-resolution map and zoom in troublesome areas in Poland. Our study is constrained by the data availability, which is not always aggregated at the same administrative level, and a limited variety of indicators, as the Central Statistical Office in Poland does not collect data tailored explicitly for energy poverty analysis.
Author Contributions
Conceptualization, L.K. and S.Ś.; methodology, L.K. and S.Ś.; software, L.K.; validation, J.P.G. and P.P.; formal analysis, L.K. and S.Ś.; investigation, L.K. and S.Ś.; resources, L.K. and S.Ś.; data curation, L.K. and S.Ś.; writing—original draft preparation, L.K.; writing—review and editing, J.P.G., P.P., and S.Ś.; visualization, S.Ś. and L.K.; supervision, S.Ś. All authors have read and agreed to the published version of the manuscript.
Funding
This article is based upon work from COST Action ‘European Energy Poverty: Agenda Co-Creation and Knowledge Innovation’ (ENGAGER 2017–2021, CA16232), supported by COST (European Cooperation in Science and Technology). Lilia Karpinska and Sławomir Śmiech gratefully acknowledge financial support from the National Science Centre in Poland (grant no. 2018/29/N/HS4/02813). João Pedro Gouveia and Pedro Palma acknowledge and are thankful for the support provided to CENSE by the Portuguese Foundation for Science and Technology (FCT) through the strategic project UIDB/04085/2020. Pedro Palma’s work has also been supported by FCT through the scholarship SFRH/BD/146732/2019.
Institutional Review Board Statement
Not applicable.
Informed Consent Statement
Not applicable.
Data Availability Statement
Not applicable.
Conflicts of Interest
The authors declare no conflict of interest.
Appendix A

Table A1.
List of variables from the EGD and the HBS, 2018.
| Household Budget Survey | Energy Consumption Survey |
|---|---|
| Year of construction Total usable floor area Number of rooms Subjective evaluation of a building’s technical condition Thermal comfort of a building (warm in winter and cool in summer) Subjective perception of a household’s financial condition Urban and rural areas Household type Regions Household disposable income | Type of a building Insulation of a building Energy costs per type of energy Electricity Central heating Warm water from central heating Natural gas Liquid gas (propane-butane) Heating oil Coal Brown coal Coke Firewood Biomass |
Figure A1.
Preliminary statistics for categorical variables from the EGD and the HBS.


Figure A2.
Boxplots for continuous variables from the EGD and the HBS.

Figure A3.
Boxplots for continuous variables from the BDL.

References
- Ministry of Energy. Energy Policy of Poland until 2040. 2018. Available online: https://www.gov.pl/web/klimat/polityka-energetyczna-polski (accessed on 2 February 2021).
- Stop Smog. National Fund for Environmental Protection and Water Management. Available online: https://czystepowietrze.gov.pl/stop-smog/ (accessed on 1 January 2021).
- Bouzarovski, S.; Thomson, H.; Cornelis, M. Confronting Energy Poverty in Europe: A Research and Policy Agenda. Energies 2021, 14, 858. Available online: https://www.mdpi.com/1996-1073/14/4/858 (accessed on 7 February 2021). [CrossRef]
- Anti-Smog, B. Uchwała Antysmogowaw Jakich Województwach Obowiązuje? LoveAir. Available online: https://loveair.pl/smog/uchwala-antysmogowa-w-jakich-wojewodztwach-obowiazuje (accessed on 1 January 2021).
- Karpinska, L.; Śmiech, S. Conceptualising housing costs: The hidden face of energy poverty in Poland. Energy Policy 2020, 147, 111819. [Google Scholar] [CrossRef]
- Karpinska, L.; Śmiech, S. Invisible energy poverty? Analysing housing costs in Central and Eastern Europe. Energy Res. Soc. Sci. 2020, 70, 101670. [Google Scholar] [CrossRef]
- Dubois, U. From targeting to implementation: The role of identification of fuel poor households. Energy Policy 2012, 49, 107–115. [Google Scholar] [CrossRef]
- Robinson, C.; Lindley, S.; Bouzarovski, S. The Spatially Varying Components of Vulnerability to Energy Poverty. Ann. Am. Assoc. Geogr. 2019, 109, 1188–1207. Available online: https://www.tandfonline.com/action/journalInformation?journalCode=raag21 (accessed on 25 March 2019). [CrossRef] [Green Version]
- Mashhoodi, B.; Stead, D.; Van Timmeren, A. Spatial Homogeneity and Heterogeneity of Energy Poverty: A Neglected Dimension. Ann. GIS 2019, 25, 19–31. Available online: https://www.tandfonline.com/action/journalInformation?journalCode=tagi20 (accessed on 18 December 2018). [CrossRef] [Green Version]
- Lowans, C.; Del Rio, D.F.; Sovacool, B.K.; Rooney, D.; Foley, A.M. What is the state of the art in energy and transport poverty metrics? A critical and comprehensive review. Energy Econ. 2021, 101, 105360. [Google Scholar] [CrossRef]
- Siksnelyte-Butkiene, I.; Streimikiene, D.; Lekavicius, V.; Balezentis, T. Energy poverty indicators: A systematic literature review and comprehensive analysis of integrity. Sustain. Cities Soc. 2021, 67, 102756. [Google Scholar] [CrossRef]
- Sánchez, C.S.-G.; Fernández, A.S.; Peiró, M.N.; Muñoz, G.G. Energy poverty in Madrid: Data exploitation at the city and district level. Energy Policy 2020, 144, 111653. [Google Scholar] [CrossRef]
- Awaworyi Churchill, S.; Smyth, R. Ethnic diversity, energy poverty and the mediating role of trust: Evidence from household panel data for Australia. Energy Econ. 2020, 86, 104663. [Google Scholar] [CrossRef]
- Sokołowski, J.; Lewandowski, P.; Kiełczewska, A.; Bouzarovski, S. A multidimensional index to measure energy poverty: The Polish case. Energy Sources Part B Econ. Plan. Policy 2020, 15, 92–112. Available online: https://www.tandfonline.com/action/journalInformation?journalCode=uesb20 (accessed on 8 April 2020). [CrossRef]
- Li, W.; Chien, F.; Hsu, C.C.; Zhang, Y.Q.; Nawaz, M.A.; Iqbal, S.; Mohsin, M. Nexus between energy poverty and energy efficiency: Estimating the long-run dynamics. Resour. Policy 2021, 72, 102063. [Google Scholar] [CrossRef]
- Halkos, G.E.; Gkampoura, E.C. Evaluating the effect of economic crisis on energy poverty in Europe. Renew. Sustain. Energy Rev. 2021, 144, 110981. [Google Scholar] [CrossRef]
- Bouzarovski, S.; Simcock, N. Spatializing energy justice. Energy Policy 2017, 107, 640–648. [Google Scholar] [CrossRef]
- Castán Broto, V.; Baker, L. Spatial adventures in energy studies: An introduction to the special issue. Energy Res. Soc. Sci. 2018, 36, 1–10. [Google Scholar] [CrossRef] [Green Version]
- Gouveia, J.P.; Palma, P.; Simoes, S.G. Energy poverty vulnerability index: A multidimensional tool to identify hotspots for local action. Energy Rep. 2019, 5, 187–201. [Google Scholar] [CrossRef]
- Palma, P.; Gouveia, J.P.; Simoes, S.G. Mapping the energy performance gap of dwelling stock at high-resolution scale: Implications for thermal comfort in Portuguese households. Energy Build. 2019, 190, 246–261. [Google Scholar] [CrossRef]
- Fahmy, E.; Gordon, D.; Patsios, D. Predicting fuel poverty at a small-area level in England. Energy Policy 2011, 39, 4370–4377. [Google Scholar] [CrossRef]
- Robinson, C.; Mattioli, G. Double energy vulnerability: Spatial intersections of domestic and transport energy poverty in England. Energy Res. Soc. Sci. 2020, 70, 101699. [Google Scholar] [CrossRef]
- Frankowski, J. Attention: Smog alert! Citizen engagement for clean air and its consequences for fuel poverty in Poland. Energy Build. 2020, 207, 109525. [Google Scholar] [CrossRef]
- Frankowski, J.; Tirado Herrero, S. “What is in it for me?” A people-centered account of household energy transition co-benefits in Poland. Energy Res. Soc. Sci. 2021, 71, 101787. [Google Scholar] [CrossRef]
- Lis, M.; Miazga, A.; Sałach, K. Location, Location, Location. What Accounts for Regional Variation of Fuel Poverty in Poland? IBS Working Paper: Warsaw, Mazowieckie, Poland, 2016; Volume 9. Available online: https://ibs.org.pl/en/publications/location-location-location-what-accounts-for-regional-variation-of-fuel-poverty-in-poland/ (accessed on 26 August 2021).
- Gouveia, J.P.; Seixas, J.; Palma, P.; Duarte, H.; Luz, H.; Cavadini, G.B. Positive Energy District: A Model for Historic Districts to Address Energy Poverty. Front. Sustain. Cities 2021, 3, 16. [Google Scholar] [CrossRef]
- Antepara, I.; Papada, L.; Gouveia, J.P.; Katsoulakos, N.; Kaliampakos, D. Improving energy poverty measurement in southern European regions through equivalization of modeled energy costs. Sustainability 2020, 12, 5721. [Google Scholar] [CrossRef]
- Tibshirani, R. Regression Shrinkage and Selection via the Lasso. J. R. Stat. Soc. Ser. B 1996, 58, 267–288. [Google Scholar] [CrossRef]
- Filippín, C.; Flores Larsen, S.; Ricard, F. Improvement of energy performance metrics for the retrofit of the built environment. Adaptation to climate change and mitigation of energy poverty. Energy Build. 2018, 165, 399–415. [Google Scholar] [CrossRef]
- Recalde, M.; Peralta, A.; Oliveras, L.; Tirado-Herrero, S.; Borrell, C.; Palència, L.; Gotsens, M.; Artazcoz, L.; Marí-Dell’Olmo, M. Structural energy poverty vulnerability and excess winter mortality in the European Union: Exploring the association between structural determinants and health. Energy Policy 2019, 133, 110869. [Google Scholar] [CrossRef]
- Pearson, K. LIII. On lines and planes of closest fit to systems of points in space. Lond. Edinb. Dublin Philos. Mag. J. Sci. 1901, 8, 559–572. [Google Scholar] [CrossRef] [Green Version]
- Hotelling, H. Analysis of a complex of statistical variables into principal components. J. Educ. Psychol. 1933, 24, 417. [Google Scholar] [CrossRef]
- Hastie, T.; Tibshirani, R.; Friedman, J. Springer Series in Statistics. In The Elements of Statistical Learning Data Mining, Inference, and Prediction; Springer: New York, NY, USA, 2008. [Google Scholar]
- Jolliffe, I.T.; Cadima, J. Principal component analysis: A review and recent developments. Philos. Trans. R. Soc. A 2016, 374, 20150202. [Google Scholar] [CrossRef]
- At-Risk-of-Poverty Threshold—EU Survey on Income and Living Conditions Eurostat. Available online: https://ec.europa.eu/eurostat/web/products-datasets/product?code=tessi014 (accessed on 1 January 2021).
- Libor, G.; Bouzarovski, S. The socio-demographic dimensions of energy poverty: A case study from Bytom, Poland. Urban Dev. Issues 2018, 57, 63–77. [Google Scholar] [CrossRef] [Green Version]
- Ziółkowska, K.; Kiełczewska, A.; Lewandowski, P. Energy Poverty among Households Living in the Detached Houses in Poland; IBS Working Paper: Warsaw, Mazowieckie, Poland, 2018; Available online: https://ibs.org.pl/en/publications/energy-poverty-among-households-living-in-the-detached-houses-in-poland/ (accessed on 26 August 2021).
- Belaïd, F. Exposure and risk to fuel poverty in France: Examining the extent of the fuel precariousness and its salient determinants. Energy Policy 2018, 114, 189–200. [Google Scholar] [CrossRef]
- Rzeczpospolita. Granica Między Polską A i Polską B Zmieniła Kształt. To Już Nie Jest Wschód-Zachód. 2016. Available online: https://www.rp.pl/Gospodarka/160929259-Granica-miedzy-Polska-A-i-Polska-B-zmienila-ksztalt-To-juz-nie-jest-wschod-zachod.html (accessed on 1 January 2021).
- Karpinska, L.; Śmiech, S. Breaking the cycle of energy poverty. Will Poland make it? Energy Econ. 2021, 94, 105063. [Google Scholar] [CrossRef]
Figure 1.
Primary energy sources for households’ space heating (EGD, 2018).

Figure 2.
Boxplots for actual and estimated annual energy costs, 2018.

Figure 3.
Geographical distribution of energy poverty in Poland, 2018: (a) hidden energy poverty per region; (b) energy poverty and PC1: degree of urbanization and building type; (c) energy poverty and PC2: elderly people in rural areas and respiratory diseases; (d) energy poverty and PC3: urbanized suburbs and small cities with poor air quality and low salaries; (e) energy poverty and PC4: inhabitants of populated areas in post-productive age earning a low income, relying on social assistance, and disparities in the economic development of some cities; and (f) energy poverty, PC1, PC2, PC3, and PC4: regional vulnerability to energy poverty. Note: all values are standardized to obtain the same range from 0 to 1.

Figure 4.
Correlation plot for the regional vulnerability factors.

Table 1.
List of variables from the BDL.
| Variables | Comments and Reference |
|---|---|
| Respiratory diseases per 1000 inhabitants, 2019 | Respiratory diseases are often linked to energy poverty in Poland due to the smog problem [2] |
| Social benefit recipients per 10,000 inhabitants, 2018 | Vulnerability associated with low-income and unemployment are often considered in the studies on energy poverty [8,19,36] |
| Average monthly gross salaries to the national average, 2018 | |
| Single-family houses per 1000 inhabitants, 2011 | Single-family houses are more affected by energy poverty in Poland [37] |
| People in post-productive age in percentage from a total number, 2018 | Elderly people are at a higher risk of energy poverty [8,19] |
| Population density in people per sq. km, 2018 | The degree of urbanization is a crucial determinant of energy poverty [14] |
| Rent arrears per one house/apartment in thousand PLN, 2018 | Arrears on housing bills increases households’ precariousness [36,38] |
Table 2.
Principal components statistics.
| Statistics/PC | 1 | 2 | 3 | 4 | 5 | 6 | 7 |
|---|---|---|---|---|---|---|---|
| Standard deviation | 1.614 | 1.051 | 0.968 | 0.910 | 0.811 | 0.724 | 0.565 |
| Proportion of variance | 0.373 | 0.158 | 0.134 | 0.118 | 0.094 | 0.075 | 0.045 |
| Cumulative proportion | 0.373 | 0.531 | 0.665 | 0.784 | 0.879 | 0.954 | 1.000 |
Table 3.
Principal components analysis for the regional vulnerability factors.
| Variables/PC | 1 | 2 | 3 | 4 | 5 | 6 | 7 |
|---|---|---|---|---|---|---|---|
| Respiratory diseases | 0.125 | 0.720 | 0.440 | −0.424 | 0.187 | −0.228 | |
| Single-family houses | −0.465 | −0.406 | −0.524 | −0.574 | |||
| Salaries | 0.417 | −0.164 | −0.126 | −0.514 | 0.261 | 0.665 | |
| People in post-productive age | 0.405 | 0.331 | 0.123 | −0.757 | 0.248 | 0.273 | |
| Social benefit recipients | −0.385 | 0.380 | 0.171 | 0.469 | 0.191 | 0.638 | −0.122 |
| Population density | 0.510 | 0.383 | −0.141 | −0.753 | |||
| Rent arrears | 0.145 | −0.440 | 0.869 | −0.107 |
Publisher’s Note: MDPI stays neutral with regard to jurisdictional claims in published maps and institutional affiliations. |
© 2021 by the authors. Licensee MDPI, Basel, Switzerland. This article is an open access article distributed under the terms and conditions of the Creative Commons Attribution (CC BY) license (https://creativecommons.org/licenses/by/4.0/).
Share and Cite
MDPI and ACS Style
Karpinska, L.; Śmiech, S.; Gouveia, J.P.; Palma, P. Mapping Regional Vulnerability to Energy Poverty in Poland. Sustainability 2021, 13, 10694. https://doi.org/10.3390/su131910694
AMA Style
Karpinska L, Śmiech S, Gouveia JP, Palma P. Mapping Regional Vulnerability to Energy Poverty in Poland. Sustainability. 2021; 13(19):10694. https://doi.org/10.3390/su131910694
Chicago/Turabian StyleKarpinska, Lilia, Sławomir Śmiech, João Pedro Gouveia, and Pedro Palma. 2021. "Mapping Regional Vulnerability to Energy Poverty in Poland" Sustainability 13, no. 19: 10694. https://doi.org/10.3390/su131910694
Note that from the first issue of 2016, this journal uses article numbers instead of page numbers. See further details here.